
About the Trend Continuation Indicator
The Trend Continuation indicator for MT5 converts standard trend tracking into a high-speed momentum tool that identifies timely buy and sell signals.
Displayed as a dual-colored cloud on the price chart, it shows blue for bullish trends and orange for bearish trends.
The indicator is suitable for scalping and intraday trading, helping traders quickly identify trend direction and potential entries during sudden price changes.
It is highly customizable, allowing adjustment of the trend continuation factor period and applied price.
Traders can use it as a standalone signal tool or combine it with other technical analysis methods for confirmation.
Its simplified design ensures a faster response to price shifts, making it ideal for traders seeking precise entry points on short-term timeframes.
Free Download
Trend continuation factor – Jurik smoothed.mq5 Indicator (MT5)
Key Features
- Utilizes a dynamic cloud system to visualize the strength of current market trends.
- Provides immediate feedback on trend direction through distinct blue and orange color shifts.
- Eliminates complex filtering to offer faster reaction times for high-frequency traders.
- Allows for granular control over sensitivity via the trend continuation factor period.
- Functions as a reliable trend-following mechanism for both trending and breakout strategies.
Indicator Chart
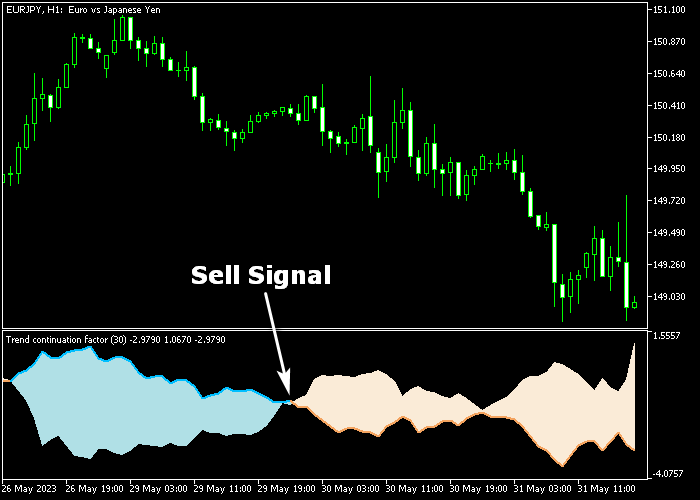
The chart displays the Trend Continuation indicator plotted as a colored cloud surrounding the price action.
A blue cloud signifies that the bullish momentum is currently dominating the market, while an orange cloud indicates a shift toward bearish control.
Traders can monitor these color changes to determine the optimal moment to enter or exit a position.
Guide to Trade with Trend Continuation Indicator
Buy Rules
- A buy signal is confirmed when the Trend Continuation cloud turns blue.
- Open a buy trade immediately once the price candles begin trading above the blue cloud.
- Verify that the momentum is increasing by observing the slope of the cloud edges.
- Maintain the buy position as long as the cloud remains blue and supports the price.
Sell Rules
- A sell signal is confirmed when the Trend Continuation cloud turns orange.
- Open a sell trade as soon as the price action drops below the orange cloud boundary.
- Look for a consistent orange formation to avoid minor price retracements or spikes.
- Keep the sell order active until the cloud shifts color or price crosses back through it.
Stop Loss
- Place a protective stop loss order below the previous swing low region for buy trades.
- Set the stop loss above the previous swing high region when entering a sell trade.
- Ensure the stop loss distance accounts for the typical volatility of the specific pair.
Take Profit
- Close the trade for a fixed take profit target based on your specific reward requirements.
- Alternatively, exit the market when the cloud changes from blue to orange or vice versa.
- Use your own preferred take profit method such as reaching a major Fibonacci level.
Trend Continuation MT5 Fast Scalping Strategy with MA Ribbon Signal
This strategy combines the Trend Continuation Indicator with the MA Ribbon Signal Indicator to build a fast scalping approach for M1 and M5 charts.
The Trend Continuation indicator appears below the price chart and uses a cloud to define short-term direction.
A blue cloud signals bullish continuation, while an orange cloud signals bearish continuation.
It is designed to quickly show whether momentum is supporting an ongoing move or shifting to the opposite side.
The MA Ribbon Signal indicator is used as a trend filter directly on the chart.
A blue MA ribbon confirms bullish structure, while an orange ribbon confirms bearish structure.
When both tools align, price tends to move more cleanly in one direction, which is ideal for scalping setups.
This strategy is focused on fast entries during active market sessions such as London and New York where short bursts of momentum are common and quick trades can be captured efficiently.
Buy Entry Rules
- Wait for the Trend Continuation cloud to turn blue below the price chart, confirming bullish continuation.
- Confirm that the MA Ribbon is blue on the main chart.
- Enter a buy trade at the close of the signal candle.
- Place the stop loss below the most recent swing low or below a short-term consolidation area.
- Trail the stop loss under the MA Ribbon as price continues upward.
- Exit the trade when the Trend Continuation cloud turns orange or when the MA Ribbon switches to orange.
Sell Entry Rules
- Wait for the Trend Continuation cloud to turn orange below the price chart, confirming bearish continuation.
- Confirm that the MA Ribbon is orange on the main chart.
- Enter a sell trade at the close of the signal candle.
- Place the stop loss above the most recent swing high or above a short-term resistance area.
- Trail the stop loss above the MA Ribbon as price moves downward.
- Exit the trade when the Trend Continuation cloud turns blue or when the MA Ribbon switches to blue.
Case Study 1: Buy Trade Example (EUR/USD M1 London Session)
The Trend Continuation cloud turned blue during a strong London session move, confirming bullish continuation.
Shortly after, the MA Ribbon turned blue, aligning trend direction across both indicators.
A buy trade was opened at the candle close with the stop loss placed below the nearest swing low.
Price moved upward quickly in short impulses, typical for M1 scalping conditions.
The long trade was exited when the Trend Continuation cloud turned orange and the MA Ribbon switched color, marking a clear end of the bullish sequence.
Case Study 2: Sell Trade Example (GBP/JPY M5 New York Session)
The Trend Continuation cloud turned orange below the price chart, confirming bearish continuation during the New York session.
The MA Ribbon also turned orange, confirming downward structure on the main chart.
A sell trade was opened at the candle close with the stop loss placed above the most recent swing high.
Price dropped in fast waves with small pullbacks, allowing a clean intraday move.
The short trade was exited when the Trend Continuation cloud switched to blue and the MA Ribbon changed color, signaling a new upward phase.
Download Now
Trend continuation factor – Jurik smoothed.mq5 Indicator (MT5)
FAQ
How does this version differ from the Jurik Smoothed version?
This is a simplified version that removes the Jurik filter.
This change allows the indicator to respond much faster to price fluctuations, making it better suited for fast-paced intraday trading.
What is the significance of the Trend Continuation Factor Period?
This parameter controls the sensitivity of the cloud.
A smaller period will make the cloud react quickly to every price move, while a larger period will provide a smoother, more stable trend view.
Can I use this indicator on the M1 timeframe?
Yes, this indicator is specifically designed to fit scalpers.
Its fast response time makes it highly effective for capturing small price movements on the M1 and M5 timeframes.
Summary
The Trend Continuation indicator provides a streamlined approach to technical analysis by merging trend detection with momentum filtering.
It allows traders to navigate different market conditions by visually separating bullish impulses from bearish pressure.
Because the signals do not repaint, the tool remains a reliable choice for those executing fast-paced strategies like scalping or day trading.
By providing a clear cloud-based visual, it helps traders stay on the right side of the market during periods of high volatility.


