
About the MA with BB Band Indicator
The MA With BB Band Indicator for MT5 combines moving averages with Bollinger Bands to deliver clear trend signals.
It measures price direction while highlighting volatility, giving traders a structured approach to identify potential entries and exits.
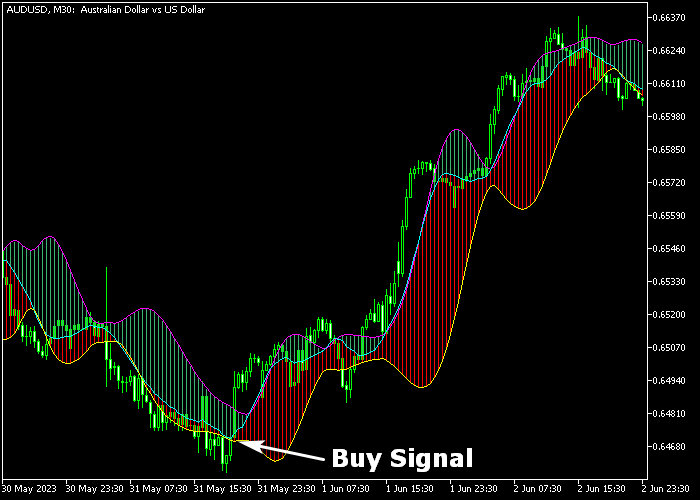
The indicator appears directly on the price chart as a colored Bollinger Bands system.
Upward pointing bands indicate a buy trend, while downward pointing bands indicate a sell trend.
Traders can customize the MA period, method, applied price, Bollinger Band period, and deviation to match their trading style and timeframe.
Free Download
MA_With_Band.mq5 Indicator (MT5)
Key Features
- Combines moving average and Bollinger Bands for trend detection.
- Colored bands provide a visual guide for bullish and bearish trends.
- Customizable MA and BB parameters for flexible trading setups.
- Helps identify volatility and trend strength simultaneously.
Indicator Chart
The MA with BB Band Indicator is displayed directly on the main price area with upper and lower Bollinger Bands and a moving average overlay.
The slope and position of the bands indicate trend direction.
Price crossing above or below the bands generates potential entry points for trades.
Guide to Trade with MA with BB Band Indicator
Buy Rules
- Wait for a candle to close above the upper Bollinger Band from below.
- Ensure the trend of the bands is pointing upwards.
- Enter a buy position at the opening of the next candle.
- Stay in the trade until the bands start flattening or slope downward.
Sell Rules
- Wait for a candle to close below the lower Bollinger Band from above.
- Ensure the trend of the bands is pointing downwards.
- Enter a sell position at the opening of the next candle.
- Stay in the trade until the bands start flattening or slope upward.
Stop Loss
- For buy trades, place the stop below the lower Bollinger Band.
- For sell trades, place the stop above the upper Bollinger Band.
- Position the stop beyond recent swing points to allow normal price fluctuations.
- Adjust position size according to the distance between bands.
Take Profit
- Close buy trades when price touches or fails at the upper Bollinger Band reversal.
- Close sell trades when price touches or fails at the lower Bollinger Band reversal.
- Partial exits can be taken near the moving average midpoint for safer profits.
- Consider trailing along the Bollinger Bands during strong trends to capture extended moves.
MA with BB Band Day Trading Strategy for MT5 with Forex Trendy Indicator
This day trading strategy combines the MA with BB Band Forex Indicator for MT5 with the Forex Trendy Indicator for MT5 to capture structured intraday trend movements with clear entry confirmation.
It is designed for traders who prefer clean directional setups on M5 and M15 charts during high liquidity sessions such as London and New York.
The approach focuses on aligning trend direction with precise signal timing to reduce false entries and improve consistency.
The MA with BB Band indicator defines the market structure through slope direction.
An upward sloping band indicates bullish conditions, while a downward sloping band indicates bearish pressure.
This provides a clear visual framework of trend direction.
The Forex Trendy indicator generates trade signals using arrows.
A green arrow indicates a buy setup, while a magenta arrow indicates a sell setup.
When both indicators agree, the probability of a successful intraday move increases significantly.
Buy Entry Rules
- Wait for the MA with BB Band to slope upward, confirming bullish trend direction.
- Confirm that price is holding above the moving average area without breaking structure.
- Enter a buy trade only when a green arrow appears from the Forex Trendy Indicator.
- Enter at the open of the next candle after both confirmations are aligned.
- Place stop loss below the most recent swing low or below the lower BB band.
- Take profit at the next resistance level or exit the trade when a magenta arrow appears or the MA with BB Band starts turning downward.
Sell Entry Rules
- Wait for the MA with BB Band to slope downward, confirming bearish trend direction.
- Confirm that price is holding below the moving average area without reclaiming structure.
- Enter a sell trade only when a magenta arrow appears from the Forex Trendy Indicator.
- Enter at the next candle open after confirmation of both conditions.
- Place stop loss above the most recent swing high or above the upper BB band.
- Take profit at the next support level or exit when a green arrow appears or the MA with BB Band begins sloping upward.
Case Study 1: EURUSD Day Trade (M15, London Session)
EURUSD formed a steady bullish structure after the London open as the MA with BB Band started sloping upward and price remained above the moving average.
The market showed controlled pullbacks without breaking structure.
A green arrow from the Forex Trendy Indicator appeared during a minor retracement, confirming a continuation signal.
A buy trade was taken on the next candle.
Price expanded upward with consistent momentum and respected the band structure.
The trade was closed for 42 pips profit when a magenta arrow appeared near resistance, showing a shift in intraday pressure and slowing bullish momentum.
Case Study 2: XAUUSD Day Trade (M5, New York Session)
Gold (XAUUSD) moved into a bearish phase during the New York session as the MA with BB Band began sloping downward and price stayed below the moving average.
Selling pressure increased after a failed recovery attempt.
A magenta arrow from the Forex Trendy Indicator confirmed the sell setup after a small pullback into resistance.
A sell trade was executed on the next candle. Price dropped quickly in a strong intraday impulse move.
The trade was closed when a green arrow appeared and price started reclaiming the moving average area, indicating a shift in short-term market direction.
Download Now
MA_With_Band.mq5 Indicator (MT5)
FAQ
How do MA with BB Bands differ from standard Bollinger Bands?
This indicator integrates a moving average with the bands, which helps filter false breakouts and highlights trend direction more clearly than standard BB alone.
Which settings are best for volatile markets?
Shorter MA periods with slightly higher BB deviation can help the bands respond quicker to rapid price movements while avoiding frequent false signals.
Can the indicator be used for breakout trading?
Yes, price crossing the upper or lower band while the bands slope in the same direction can signal a strong breakout opportunity.
Is it suitable for all timeframes?
It works across multiple timeframes. Shorter periods are ideal for scalping, while longer periods fit intraday and swing trading.
Summary
The MA with BB Band Indicator combines trend and volatility analysis in one system.
It highlights directional bias while signaling potential entry and exit points based on band interactions.
By trading with the slope of the bands and price touches, traders can follow trends systematically.
When integrated into a defined trade plan and monitored closely, it provides a structured approach for trend-focused strategies.


