
About the Smoothed Kijun Sen Indicator
The Smoothed Kijun Sen Indicator for MT5 provides clear trend signals using smoothed price lines, helping traders quickly identify bullish and bearish moves.
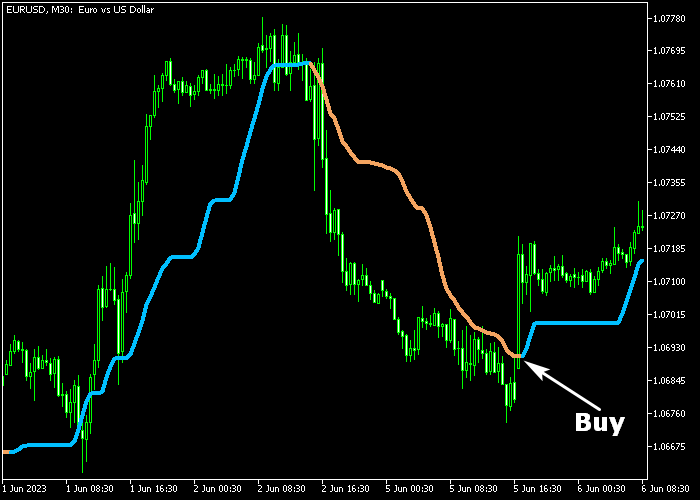
Blue lines indicate rising momentum and potential buy opportunities, while brown lines point to weakening markets and potential sell opportunities.
You can customize the Kijun period, smoothing period, and smoothing method to suit your preferred trading style.
The smoothed approach filters out minor price fluctuations, making it easier to focus on meaningful trends and take timely trades.
Whether you trade short-term moves or longer trends, the Smoothed Kijun Sen line gives a simple, visual way to follow the market and plan entries and exits efficiently.
Free Download
Smoothed Kijun-Sen.mq5 Indicator (MT5)
Key Features
- Blue line signals bullish trends; brown line signals bearish trends.
- Customizable Kijun period, smoothing period, and smoothing method.
- Smoothed signals help reduce noise from minor market fluctuations.
- Easy-to-read visual trend indicator for timely trade decisions.
Indicator Chart
The Smoothed Kijun Sen line displays as a smooth trend line on the main price chart.
Blue indicates rising price momentum and potential buy zones, while brown indicates weakening price momentum and potential sell zones.
Following the line can help traders enter trades in the direction of the prevailing trend.
Guide to Trade with the Smoothed Kijun Sen Indicator
Buy Rules
- Observe the blue Kijun Sen line forming, signaling bullish momentum.
- Confirm that the price is near or above recent swing support levels.
- Open a buy trade as the line solidifies for trend confirmation.
Sell Rules
- Watch for the brown Kijun Sen line appearing, indicating bearish momentum.
- Confirm the price is approaching resistance or showing early signs of decline.
- Open a sell trade once the line forms for a reliable entry.
Stop Loss
- For buy trades, place your stop just under the nearest cluster of support candles.
- For sell trades, set your stop just above the most recent cluster of resistance candles.
Take Profit
- Close buy trades when the brown line appears, or use a fixed pip target based on your strategy.
- Close sell trades when the blue line appears, or set a pre-defined profit level.
Smoothed Kijun Sen Indicator MT5 Strategy with Vortex Trend
This strategy combines the Smoothed Kijun Sen Indicator with the Vortex Trend Indicator to trade clear trend continuation setups with precise timing.
The Smoothed Kijun Sen line acts as the main trend filter.
A blue line shows a buy trend, while a brown line shows a sell trend.
Since it is based on a smoothed version of the traditional Kijun Sen, it filters noise and provides a cleaner view of direction.
The Vortex Trend indicator helps confirm entries.
A green histogram signals a buy setup, while a red histogram signals a sell setup.
This strategy works well on M15 and H1 timeframes.
Buy Entry Rules
- Wait for the Smoothed Kijun Sen line to turn blue.
- Confirm the line remains blue and price stays above it.
- Enter a buy trade when the Vortex Trend prints a green histogram bar.
- Place the stop loss a few pips below the recent swing low.
- Close the trade when the Vortex histogram turns red or when the Kijun Sen line turns brown.
Sell Entry Rules
- Wait for the Smoothed Kijun Sen line to turn brown.
- Confirm the line remains brown and price stays below it.
- Enter a sell trade when the Vortex Trend prints a red histogram bar.
- Place a few pips stop loss above the recent swing high.
- Close the trade when the Vortex histogram turns green or when the Kijun Sen line turns blue.
Case Study (EURJPY M15)
The Smoothed Kijun Sen line turned blue and price stayed above it, confirming a bullish trend.
After a short consolidation, the Vortex Trend printed a green histogram bar.
A buy trade was opened at that moment.
The stop loss was placed below the recent swing low.
Price continued moving higher while the Kijun Sen line remained blue.
The long trade was held until the Vortex histogram turned red, which signaled the exit.
Case Study (USDCAD H1)
The Smoothed Kijun Sen line turned brown and price stayed below it, confirming a bearish trend.
Later, the Vortex Trend printed a red histogram bar after a small pullback.
A sell trade was opened after this confirmation.
The stop loss was placed above the recent swing high.
Price moved lower in a steady trend while the Kijun Sen line stayed brown.
The short trade was closed when the Vortex histogram turned green, marking the end of the setup.
Download Now
Smoothed Kijun-Sen.mq5 Indicator (MT5)
FAQ
Can I use this indicator on multiple timeframes?
Yes, the Smoothed Kijun Sen works on any timeframe. Traders can monitor both short-term and long-term trends for more precise trade timing.
How does smoothing affect the signals?
Smoothing filters minor market fluctuations, allowing traders to focus on meaningful trend movements and reduce noise that could trigger false entries.
Is it suitable for scalpers as well as swing traders?
Yes, the indicator can be adjusted for short-term trades like scalping or for longer-term trend positions, depending on the Kijun and smoothing periods used.
Summary
The Smoothed Kijun Sen Indicator gives traders a simple and visual way to follow market trends.
Its smooth blue and brown lines highlight bullish and bearish momentum, making it easier to identify trading opportunities without overcomplicating analysis.
With adjustable smoothing and Kijun periods, the indicator adapts to various trading styles.
By combining its signals with strategic stop loss and take profit planning, traders can manage risk effectively while staying aligned with prevailing trends.
This makes it a versatile tool for both short-term and longer-term trading strategies.


