

About the Relative Strength Oscillator
The Relative Strength Oscillator for MT5 is a momentum-based tool designed to capture short-term buying and selling opportunities.
It is particularly useful for scalpers and day traders who aim to extract quick moves from the market.
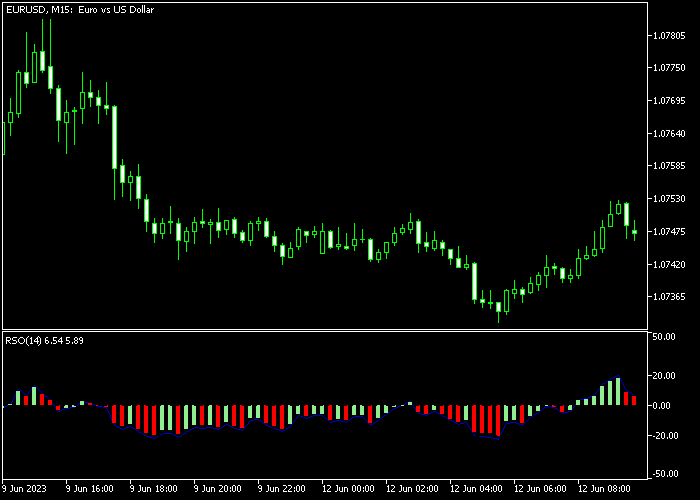
The indicator appears in a separate window below the main price chart as a histogram.
Bars plotted above the zero level indicate bullish pressure, while bars below zero reflect bearish momentum.
This simple zero-line approach makes it easy to detect potential shifts in market direction.
Traders often target modest intraday gains, typically in the range of 8 to 20 pips per trade.
The oscillator works best on low-spread currency pairs such as EUR/USD, GBP/USD, and USD/JPY.
The RSO period can be adjusted to control signal sensitivity.
A shorter period produces more frequent signals, while a longer period smooths out fluctuations.
Free Download
Key Features
- Histogram-based oscillator plotted below the price chart.
- Zero-line crossover signals for bullish and bearish entries.
- Adjustable RSO period for sensitivity control.
- Designed for scalping and short-term trading strategies.
- Works effectively on low-spread major currency pairs.
- Helps identify short bursts of momentum.
- Suitable for intraday trading sessions.
Indicator Chart
The Relative Strength Oscillator displays colored histogram bars in a bottom window.
When the bars rise above zero, bullish momentum builds. When they drop below zero, bearish pressure increases.
This layout allows traders to monitor momentum shifts alongside price action and react quickly to potential reversals.
Guide to Trade with Relative Strength Oscillator
Buy Rules
- Enter a buy trade when the histogram crosses from below zero to above zero.
- Confirm that price action supports upward momentum.
- Focus on signals that occur after short pullbacks in an emerging up move.
- Monitor histogram expansion to assess strengthening bullish pressure.
Sell Rules
- Enter a sell trade when the histogram crosses from above zero to below zero.
- Confirm that price action supports downward momentum.
- Look for signals that follow brief retracements in a developing downtrend.
- Observe histogram growth below zero as confirmation of selling strength.
Stop Loss
- For buy trades, place the stop a few pips below the candle that triggered the zero-line crossover.
- For sell trades, place the stop a few pips above the candle that triggered the zero-line crossover.
- Avoid placing stops too tightly during high-impact news releases.
Take Profit
- Close buy trades when the histogram crosses back below zero.
- Close sell trades when the histogram crosses back above zero.
- Consider partial exits if momentum weakens near the zero line.
- Use opposite zero-line crossovers as the primary exit signal.
Relative Strength Oscillator Forex Day Trading Strategy for MT5
This day trading strategy combines the Relative Strength Oscillator for MT5 with the Super Arrow Buy Sell Indicator for MT5 to capture intraday momentum moves with clear confirmation and timing.
The Relative Strength Oscillator measures momentum around a zero line. Buy signal above while sell signal below.
The Super Arrow indicator confirms direction using visual signals.
A blue arrow signals bullish momentum, while a red arrow signals bearish pressure.
It helps filter weak oscillator moves and improves entry timing during active sessions.
This strategy works best on M5, M15, and M30 charts.
It is designed for day traders focusing on the London and New York sessions, where EUR/USD and XAU/USD show strong intraday movement.
Buy Entry Rules
- Wait for the Relative Strength Oscillator to cross from below zero to above zero.
- Confirm that a blue arrow appears from the Super Arrow indicator.
- Enter a buy trade at the next candle open after confirmation.
- Place a stop loss below the most recent swing low or below the signal candle structure.
- Take profit when a red arrow appears or when the oscillator crosses back below zero, signaling a shift in momentum.
Sell Entry Rules
- Wait for the Relative Strength Oscillator to cross from above zero to below zero.
- Confirm that a red arrow appears from the Super Arrow indicator.
- Enter a sell trade at the opening of the next candle.
- Place a stop loss above the most recent swing high or above the signal candle structure.
- Take profit when a blue arrow appears or when the oscillator crosses back above zero, indicating bullish pressure returning.
Case Study 1: Buy Day Trade (EUR/USD, M15)
EUR/USD moved into a short consolidation phase after a bearish session in London.
The Relative Strength Oscillator crossed from below zero to above zero, showing renewed bullish momentum.
A blue arrow from the Super Arrow indicator confirmed the buy setup.
A long position was opened on the next candle.
Price expanded upward in a clean intraday trend and formed higher highs across multiple candles.
The trade was closed for +24 pips when a red arrow appeared near resistance and the oscillator started curling back toward the zero line, signaling a slowdown in bullish strength.
Case Study 2: Sell Trade (XAU/USD, M5)
Gold (XAU/USD) attempted a weak recovery during the New York session but failed to break previous highs.
The Relative Strength Oscillator crossed from above zero to below zero, confirming bearish momentum.
A red arrow from the Super Arrow indicator appeared shortly after, confirming the sell entry.
A short position was taken on the next candle.
Price dropped sharply with strong volatility and continued lower in a fast intraday move.
The trade was closed when a blue arrow printed and the oscillator crossed back above zero, indicating a return of buying pressure.
Download Now
FAQ
What does the zero line represent in the RSO?
The zero level separates bullish and bearish momentum. Bars above zero indicate buying pressure, while bars below zero reflect selling pressure.
Which period setting works best?
A shorter RSO period generates faster signals suited for scalping. A longer period reduces noise and may suit slower intraday strategies.
Is the oscillator suitable for volatile sessions?
Yes. It performs well during active market hours such as the London and New York sessions when momentum shifts are more pronounced.
Can I combine it with other indicators?
Yes. Many traders pair it with support and resistance analysis or moving averages to confirm trade direction and filter false entries.
Summary
The Relative Strength Oscillator is a practical momentum tool designed for short-term traders seeking quick opportunities.
Its histogram format and zero-line logic make trade direction easy to interpret.
With adjustable sensitivity and compatibility across major currency pairs, it adapts well to different trading conditions.
Using opposite zero-line crossovers for exits helps traders stay aligned with momentum shifts.
For scalpers and active day traders, the RSO offers a focused approach to capturing small but consistent market movements.





