
About the Money Flow Index (MFI) Indicator
The Money Flow Index (MFI) Indicator for MT5 measures market momentum and the strength of price movements.
It helps traders identify potential trade entry points by combining price and volume into a single oscillator.
The indicator appears in a separate window below the main price area as a blue line that oscillates above and below the neutral 50 level.
Oversold and overbought conditions are highlighted when the MFI approaches 30 and 70, making it easier to spot opportunities in trending markets.
MFI is particularly useful for timing entries in uptrends and downtrends.
It can be combined with other technical tools, such as moving averages, to improve trade confirmation.
Traders can adjust MFI period, tick volume, color, and style to match their preferred timeframe and instrument.
This indicator works well for scalpers, intraday traders, and swing traders who focus on momentum and trend strength.
Free Download
Key Features
- Blue line oscillator to measure price momentum combined with volume.
- Detects oversold (30) and overbought (70) conditions.
- Customizable MFI period and tick volume.
- Adjustable color and line style.
- Helps identify potential entry points in trending markets.
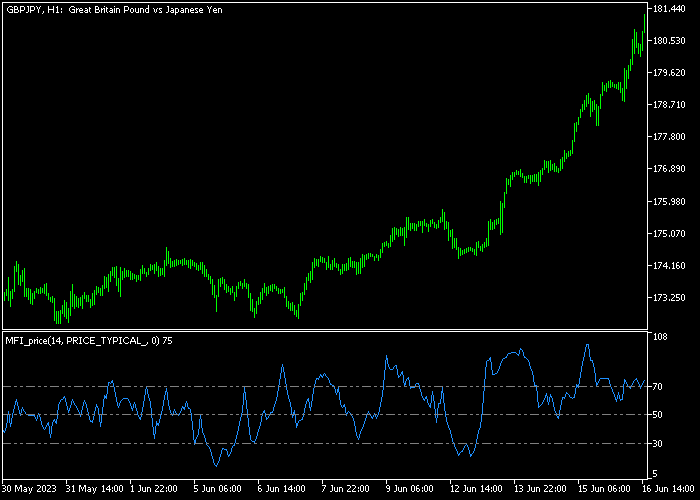
Indicator Chart
The MFI Indicator plots a blue oscillating line beneath the main price area.
Values above 50 generally indicate bullish momentum, while values below 50 indicate bearish momentum.
Overbought zones near 70 may signal weakening bullish pressure, and oversold zones near 30 may signal weakening bearish pressure.
These oscillations help traders anticipate potential trade opportunities in trending markets.
Guide to Trade with Money Flow Index (MFI) Indicator
Buy Rules
- Ensure the market is in an uptrend before considering a buy trade.
- Wait for the MFI line to cross back above the 30 level from below.
- Enter a buy position as soon as this crossover occurs.
- Follow the direction of the MFI while it remains above the 30 level.
Sell Rules
- Ensure the market is in a downtrend before considering a sell trade.
- Wait for the MFI line to cross back below the 70 level from above.
- Enter a sell position as soon as this crossover occurs.
- Follow the direction of the MFI while it remains below the 70 level.
Stop Loss
- For buy trades, place the stop below the most recent support level.
- For sell trades, place the stop above the most recent resistance level.
- Keep stops within confirmed swing points to maintain accuracy.
Take Profit
- Close buy trades at a predetermined target or when the stop is triggered.
- Close sell trades at a predetermined target or when the stop is triggered.
- Optional: use oversold/overbought levels as partial profit points (70 for buys, 30 for sells).
Money Flow Index MFI Fast Day Trading Strategy for MT5
This strategy combines the Money Flow Index MFI indicator with the 3 MAs Alert Crossing indicator to create a fast day trading system that captures quick intraday moves.
The MFI indicator helps identify momentum shifts and overbought or oversold conditions, while the 3 MAs Alert Crossing indicator highlights trend direction with clear blue and red arrows.
Together, these tools provide both trend and momentum confirmation, making it ideal for traders who want rapid entries on shorter timeframes like M5 and M15.
This system is designed to be clear and actionable with tight risk controls and straightforward exits.
Buy Entry Rules
- Enter a buy when the MFI line crosses back above 30.
- Confirm with a blue arrow from the 3 MAs Alert Crossing indicator.
- Set a stop loss a few pips below the recent swing low.
- Take profit near the next resistance, when MFI nears 70, or if a red arrow appears.
Sell Entry Rules
- Enter a sell when the MFI line crosses back below 70.
- Confirm with a red arrow from the 3 MAs Alert Crossing indicator.
- Set a stop loss a few pips above the recent swing high.
- Take profit near the next support, when MFI nears 30, or if a blue arrow appears.
Case Study 1: Bullish Reversal and Momentum Confirmation
On a 5-minute EUR/USD chart, the MFI line had crossed below 30 earlier and was beginning to recover.
When the MFI line crossed back above 30, this signaled renewed buying pressure.
Shortly after, the 3 MAs Alert Crossing indicator showed a blue arrow, indicating bullish moving average alignment.
With both signals aligning, a buy trade was executed with a stop loss just under the recent swing low.
As price climbed, the MFI approached the high 70s and momentum remained firm.
The long trade was closed near a minor resistance zone before MFI reached overbought levels.
Case Study 2: Bearish Trend Capture with Confirmed Momentum
On a 15-minute GBP/JPY chart, the MFI was above 70 and started turning down.
When it crossed back below 70, this suggested that buying momentum was fading and sellers were gaining control.
Almost immediately, a red arrow appeared from the 3 MAs Alert Crossing indicator as the moving averages aligned bearish.
A sell entry was taken with a stop loss placed just above a recent minor resistance area.
Price continued lower, and the MFI moved toward oversold territory near 30.
The trade was closed at a nearby support level, capturing a strong 67 pip intraday move.
Download Now
FAQ
What does the MFI measure?
The Money Flow Index combines price and volume to measure momentum. It helps identify the strength of trends and potential reversal points.
How do the 30 and 70 levels work?
Readings below 30 suggest oversold conditions and potential buy opportunities, while readings above 70 suggest overbought conditions and potential sell opportunities.
Which timeframes are best for the MFI?
It can be applied to any timeframe. Scalpers often use 1- to 5-minute charts, while swing traders focus on 1-hour or daily charts.
Can the MFI be combined with other indicators?
Yes. Many traders pair it with moving averages, trend lines, or support/resistance levels to improve entry accuracy.
Summary
The Money Flow Index (MFI) Indicator provides a reliable measure of momentum and strength in the market.
Its blue oscillating line highlights potential entry zones and trend shifts.
Adjustable parameters allow it to fit different trading styles and instruments.
Used with complementary tools, MFI helps traders identify trade opportunities efficiently.
This indicator is valuable for scalping, intraday, and swing trading, giving traders a practical method for monitoring momentum and timing entries.


