

About the TRIX Candle Keltner Signal Indicator
The TRIX Candle Keltner Signal Indicator for MT5 combines momentum and volatility into one focused trading tool.
It blends the TRIX oscillator with a Keltner-style cloud to highlight short-term trading opportunities.
The indicator appears in a separate window where a dynamic cloud surrounds bullish and bearish candles.
Green candles reflect upward pressure, while red candles show downward momentum.
The cloud acts as a trend filter and helps define active trading zones.
By merging momentum strength with volatility boundaries, the indicator delivers timely entries during trending phases.
Traders can adjust the momentum period, TRIX period defaulted at 14, and visual style to match their preferred market conditions.
Free Download
TriXCandleKeltner.mq5 Indicator (MT5)
Key Features
- Combines TRIX momentum with a Keltner-based cloud filter.
- Displays green candles for bullish setups.
- Displays red candles for bearish setups.
- Cloud highlights active momentum zones.
- Customizable momentum and TRIX period settings.
- Designed for short-term trading opportunities.
Indicator Chart
The TRIX Candle Keltner Signal Indicator is shown in a dedicated window below the main price area.
A cloud defines the active trading zone while green and red candles signal trend direction.
The first color change within the cloud often marks the start of a potential move.
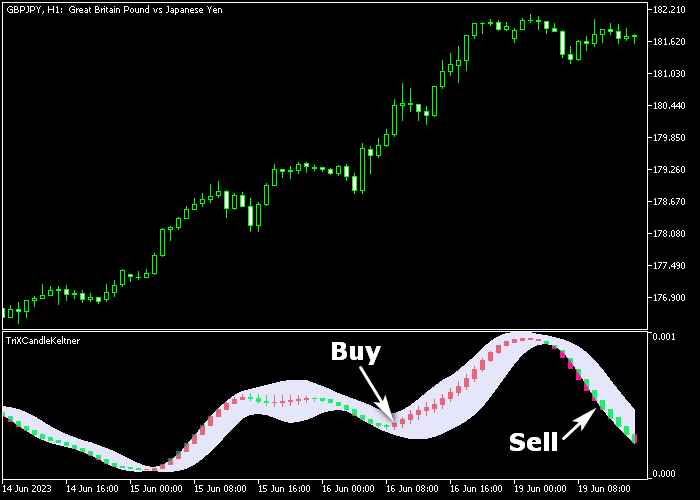
Guide to Trade with TRIX Candle Keltner Signal Indicator
Buy Rules
- Wait for the first green candle to form inside the cloud.
- Confirm that bullish momentum is building.
- Open a buy trade at the close of the green candle.
- Check that overall market flow supports upside continuation.
Sell Rules
- Wait for the first red candle to form inside the cloud.
- Confirm that bearish momentum is increasing.
- Open a sell trade at the close of the red candle.
- Ensure downside pressure remains consistent.
Stop Loss
- Place the stop loss 3 pips below the latest support zone for buy trades.
- Place the stop loss 3 pips above the latest resistance zone for sell trades.
- Adjust stops according to recent volatility conditions.
Take Profit
- Target 15 to 35 pips for short-term setups.
- Close buy trades when a red candle appears inside the cloud.
- Close sell trades when a green candle appears inside the cloud.
- You may also trail profits while momentum remains intact.
TRIX Candle Keltner MT5 Forex Strategy with Trend Signals V2 Indicator
This intraday strategy combines the TRIX Candle Keltner Indicator with the Trend Signals V2 Forex Indicator to capture clean entries during the London and US sessions.
It focuses on trend direction and early momentum signals to enter trades with clarity.
The TRIX Candle Keltner indicator uses filtered TRIX candles inside volatility bands.
This helps traders catch moves early before extended trends develop.
The Trend Signals V2 indicator highlights trend direction using a coloured line.
A blue line indicates prevailing bullish conditions, while a red line indicates bearish pressure.
Aligning the trend direction with breakout candles helps filter weak or countertrend signals.
This strategy works best on M5 and M15 charts during the London and US sessions when volatility is elevated and trends can develop quickly.
Buy Entry Rules
- Confirm that the Trend Signals V2 line is blue, indicating bullish trend direction.
- Wait for the first green TRIX Candle Keltner candle following a pullback or consolidation.
- Enter a buy trade at the opening of the next candle after the green candle signal.
- Place a stop loss below the recent swing low or the volatility band’s lower edge.
- Take profit near the next resistance level or when the Trend Signals V2 line flips red.
Sell Entry Rules
- Confirm that the Trend Signals V2 line is red, indicating bearish trend direction.
- Wait for the first red TRIX Candle Keltner candle following a minor retracement.
- Enter a sell trade at the opening of the next candle after the red candle signal.
- Place the stop loss above the recent swing high or the volatility band’s upper edge.
- Take profit near the next support level or when the Trend Signals V2 line turns blue.
Case Study 1: GBPUSD M5 London Breakout
On GBPUSD M5 during the early London session, the Trend Signals V2 line turned blue after a consolidation range broke upward.
Shortly after, the TRIX Candle Keltner printed a first green candle following a pullback toward the lower band.
These signals aligned and suggested renewed bullish pressure.
A buy trade was entered at the next candle. The stop loss was placed below the recent consolidation low and the lower volatility band.
Price pushed higher with a succession of strong bullish candles.
The position was closed near a resistance area when the Trend Signals V2 line flattened and showed early signs of reversing.
Case Study 2: USDJPY M15 US Session Pullback
During the US session on USDJPY M15, the Trend Signals V2 line was red, confirming bearish trend pressure after the London session slowdown.
Price retraced slightly, and the first red TRIX Candle Keltner candle formed just below the volatility band upper edge.
These signals aligned with the underlying trend and offered a quality sell setup.
A sell trade was executed at the next candle. The stop loss was placed above the retracement high.
Price resumed its downward move with clear bearish candles.
The trade was closed near a short‑term support cluster, locking in a solid 32 pip intraday gain.
Download Now
TriXCandleKeltner.mq5 Indicator (MT5)
FAQ
What role does the cloud play in this indicator?
The cloud acts as a volatility filter. Trades are typically taken when candles form within it, signaling active momentum conditions.
Why is the TRIX period set to 14 by default?
The period of 14 balances responsiveness and smoothing. Traders can reduce it for faster signals or increase it for more stable readings.
Is this indicator suitable for scalping?
Yes. It is designed for short-term trading and performs well on lower timeframes when markets show consistent movement.
Can I adjust the momentum period separately?
Yes. The momentum period is fully customizable, allowing traders to fine tune signal sensitivity based on their strategy.
Summary
The TRIX Candle Keltner Signal Indicator merges momentum and volatility into a focused cloud-based system.
The combination of colored candles and a dynamic band helps traders spot emerging moves early.
With adjustable settings and straightforward visual signals, it supports active trading strategies that rely on short-term trend continuation and timely reversals.





