About the 3D Oscillator Indicator
The 3D Oscillator indicator for MT5 is a specialized momentum tool designed primarily for scalpers.
It integrates the Relative Strength Index (RSI) with Stochastic oscillators to identify precise entry points within a trending market.
By smoothing these two powerful calculations, the tool filters out minor price fluctuations, allowing traders to focus on high-probability momentum shifts.
Its main benefit lies in its ability to provide fast, actionable signals without the lag associated with traditional oscillators.
While it functions as a standalone entry tool, it is most effective when used to confirm trades in the direction of a higher-timeframe trend.
This approach helps traders maintain a consistent edge in fast-moving currency markets.
Free Download
3d_oscilator.mq5 Indicator (MT5)
Key Features
- Combines RSI and Stochastic logic to deliver balanced momentum readings.
- Features a smoothing mechanism to reduce false signals during low volatility.
- Optimized for low-timeframe scalping on M1, M5, and M15 charts.
- Fully adjustable parameters including RSI period, Stochastic period, and signal smoothing.
- Designed to catch quick price movements with a target of 5 to 15 pips per trade.
Indicator Chart
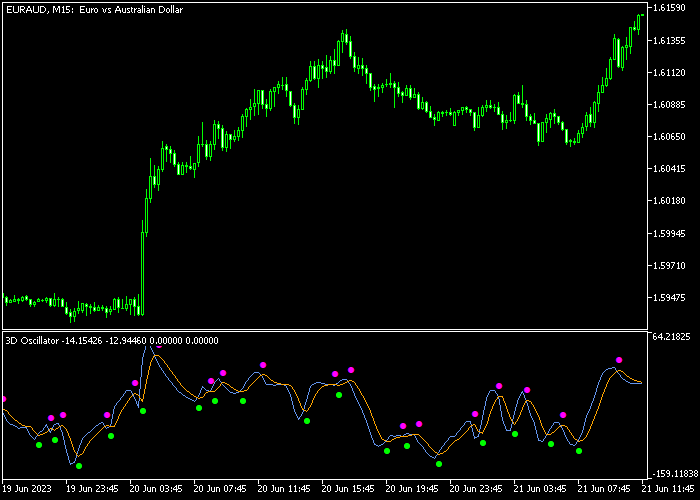
The chart displays the 3D Oscillator indicator positioned in the bottom window below the price action.
You can see how the green dots align with bullish momentum and the purple dots mark bearish shifts.
This visual setup makes it easy to spot entry points as soon as the oscillators align.

Guide to Trade with the 3D Oscillator Indicator
Buy Rules
- Confirm that the market is in a sustained uptrend on the current timeframe.
- Wait for a green signal dot to appear in the 3D Oscillator window.
- Open a buy order at the start of the next candle after the dot appears.
Sell Rules
- Ensure the broader market trend is clearly pointing in a downward direction.
- Look for a purple signal dot to manifest in the indicator sub-window.
- Place a sell order immediately following the close of the signaling candle.
Stop Loss
- For buy positions, set the stop loss just below the immediate support level.
- For sell positions, place the stop loss right above the immediate resistance zone.
- Keep the stop loss tight to maintain a healthy risk-to-reward ratio.
Take Profit
- Set a fixed take profit objective between 5 and 15 pips per trade.
- Monitor price action near major round numbers to lock in gains early.
- Close the position if the momentum shows signs of stalling before the target.
- Follow the 1.0 risk-to-reward rule to ensure long-term account growth.
3D Oscillator Fast Scalping MT5 Strategy with MACD Indicator
This fast scalping strategy combines the 3D Oscillator Indicator and the MACD Indicator to capture small, quick price moves on M1 and M5 charts.
It is specifically designed for traders targeting 5-10 pips per trade during high volatility periods.
The 3D Oscillator indicator provides immediate buy and sell signals using colored dots.
Green dots suggest bullish entries, while purple dots indicate bearish setups.
These dots appear near short-term turning points, making them ideal for quick scalps.
The MACD confirms momentum by indicating whether price is in a bullish or bearish state.
When the MACD is above zero, bullish trades are preferred. When below zero, only bearish trades are considered.
This combination filters false signals and increases probability for fast trades.
This strategy works best during the London and New York sessions when price volatility is high.
It suits scalpers who want rapid entries and exits with strict risk control.
Buy Entry Rules
- Wait for a green dot from the 3D Oscillator Indicator.
- Confirm that the MACD is above zero.
- Enter a buy trade at the opening of the next candle.
- Place stop loss 3-5 pips below the entry candle low.
- Take profit at 5-10 pips or when a purple dot appears, whichever comes first.
Sell Entry Rules
- Wait for a purple dot from the 3D Oscillator Indicator.
- Confirm that the MACD is below zero.
- Enter a sell trade at the opening of the next candle.
- Place stop loss 3-5 pips above the entry candle high.
- Take profit at 5-10 pips or when a green dot appears, whichever comes first.
Case Study 1: Rapid EURUSD M1 Scalping
During the London session on EURUSD M1, a green dot appeared after a minor pullback.
The MACD was above zero, confirming bullish momentum. A buy trade was executed at the next candle with a 4-pip stop loss.
Price moved quickly in favor of the trade.
The position was closed at a 6-pip profit when a small purple dot appeared.
Case Study 2: Fast USDJPY M5 Bearish Trade
On USDJPY M5 during the New York session, a purple dot appeared after a brief upward retracement.
The MACD was below zero, confirming a bearish setup. A sell trade was opened with a 5-pip stop loss.
Price dropped sharply within a few candles.
The trade was closed at a 7-pip profit when the 3D Oscillator generated a green dot, signaling a potential short-term reversal.
Download Now
3d_oscilator.mq5 Indicator (MT5)
FAQ
What are the primary inputs for this indicator?
You can adjust the RSI and Stochastic periods to change sensitivity.
The “hot” and “signal smooth” settings further refine how quickly the dots react to price changes.
Lowering these values makes the indicator faster, while higher values provide more filtered, conservative signals.
Is this indicator suitable for long-term swing trading?
While it works on daily charts, it is specifically optimized for scalping.
If using it for swing trading, it is best to increase the smoothing parameters to avoid premature exits.
Does the 3D Oscillator work on all currency pairs?
Yes, it performs well on all major and minor forex pairs.
However, because it targets small pip ranges, it is most effective on pairs with low spreads like EURUSD or USDJPY.
High-spread pairs may eat into the 5-15 pip profit targets typical of this strategy.
Summary
The 3D Oscillator indicator provides a streamlined approach to technical analysis by merging trend detection with momentum filtering.
It allows traders to navigate different market conditions by visually separating bullish impulses from bearish pressure.
Because the signals do not repaint, the tool remains a reliable choice for those executing fast-paced strategies like scalping or day trading.


