
About the AFIRMA Indicator
The AFIRMA indicator for MT5 is a trend forecasting tool designed to help traders anticipate market direction.
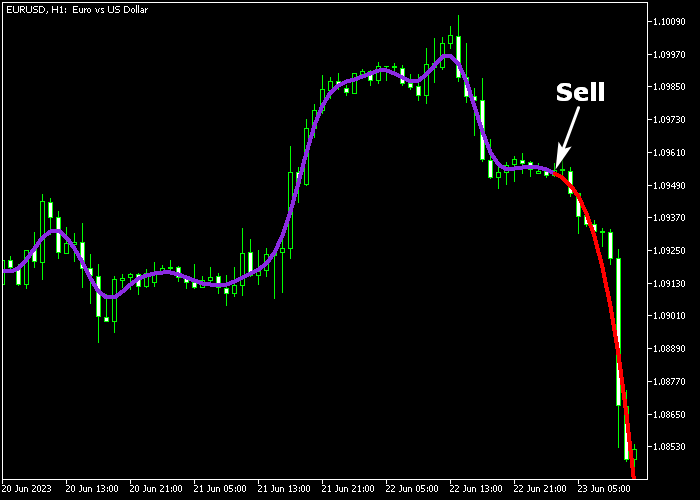
It uses a two-color signal line plotted directly on the price chart to indicate bullish or bearish momentum.
The purple line signals bullish trends, while the red line signals bearish trends.
This straightforward visualization allows traders to quickly identify potential entry points and monitor ongoing trend strength.
The indicator can be customized with inputs such as LF transmission width, delay units in the filter, window index, shift, and line colors.
It works on any timeframe and can be combined with other technical tools for trend confirmation or used independently.
Free Download
Key Features
- Two-color forecasting line to indicate bullish and bearish trends.
- Customizable parameters including LF transmission width, filter delay, window index, and shift.
- Provides simple and intuitive visual signals.
- Can be combined with other technical indicators for improved accuracy.
- Reduces guesswork by clearly highlighting trend direction.
Indicator Chart
The AFIRMA indicator appears as a colored line on the main price chart.
Purple lines suggest upward market movement, while red lines suggest downward movement.
Traders can use the line crossings and color shifts to time entries and exits effectively.
Guide to Trade with AFIRMA Indicator
Buy Rules
- Wait for the purple AFIRMA line to appear or turn up on the chart.
- Open a buy trade once the line confirms the trend.
Sell Rules
- Wait for the red AFIRMA line to appear or turn down on the chart.
- Open a sell trade once the line confirms the trend.
Stop Loss
- Place stop loss slightly below the most recent swing low for buy trades.
- Place stop loss slightly above the most recent swing high for sell trades.
- Use a small buffer of 2–3 pips to avoid being stopped out by minor fluctuations.
Take Profit
- Close buy trades when the AFIRMA line turns red.
- Close sell trades when the AFIRMA line turns purple.
- Trailing along the line until the opposite color appears can capture extended moves.
AFIRMA Indicator MT5 Scalping Strategy with Zero Lag RSI OSMA Indicator
This scalping strategy combines the AFIRMA Indicator and the Zero Lag RSI OSMA Indicator to capture fast and precise entries during high-volatility sessions.
It is designed specifically for the London and New York sessions where price moves are more aggressive and frequent.
The AFIRMA indicator provides a clear visual trend using its color-coded line.
A purple line signals a bullish environment while a red line indicates bearish pressure.
The Zero Lag RSI OSMA adds momentum confirmation using a histogram that reacts quickly to price changes.
Bars above the zero level indicate bullish momentum while bars below signal bearish momentum.
Its reduced lag allows traders to react faster during scalping conditions.
This strategy works best on M1 and M5 timeframes.
Buy Entry Rules
- Wait for the AFIRMA line to turn purple.
- Confirm that the histogram is blue and above the zero level.
- Enter a buy trade at the opening of the next candle.
- Place stop loss below the most recent short-term swing low.
- Take profit when the histogram turns pink or when the AFIRMA line changes color.
Sell Entry Rules
- Wait for the AFIRMA line to turn red.
- Confirm that the histogram is pink and below the zero level.
- Enter a sell trade at the opening of the next candle.
- Place stop loss above the most recent short-term swing high.
- Take profit when the histogram turns blue or when the AFIRMA line changes color.
Case Study 1: London Session Momentum Scalping
On EURGBP M5 during the London session, the market began trending upward after a period of consolidation.
The AFIRMA line turned purple, indicating a bullish trend.
At the same time, the Zero Lag RSI OSMA histogram printed a strong blue bar above zero which confirmed upward momentum.
A buy trade was opened immediately after the candle closed. The stop loss was placed below a recent minor pullback.
Price moved quickly in favor of the trade with strong bullish candles.
The position was closed when the histogram started to fade and printed a pink bar, locking in a fast scalp profit.
Case Study 2: New York Session Reversal Scalping
On USDCHF M1 during the New York session, price showed a sharp rejection from resistance.
The AFIRMA line shifted to red, signaling a bearish trend.
At the same time, the histogram dropped below zero and printed a pink bar, confirming selling momentum.
A sell trade was entered on the next candle. The stop loss was placed just above the recent high.
Price dropped rapidly as volatility increased.
The trade was closed for 17 pips profit when the histogram flipped back to blue, capturing a quick intraday move.
Download Now
FAQ
How does the AFIRMA line indicate trend changes?
The AFIRMA line changes color to show trend direction. Purple signals a bullish trend, red signals a bearish trend.
Can AFIRMA be used on all timeframes?
Yes, it works on any timeframe. Shorter timeframes are ideal for scalping, while higher timeframes help confirm larger trend movements.
Is the indicator reliable on volatile pairs?
AFIRMA handles volatility well, but combining it with support/resistance levels or trend filters can reduce false signals during choppy markets.
Do I need other indicators to trade with AFIRMA?
No, it can be used independently. However, adding momentum or trend confirmation tools can increase confidence and refine entries.
Summary
The AFIRMA indicator is a user-friendly tool for forecasting market trends. Purple lines suggest buying opportunities, while red lines indicate selling opportunities.
Its two-color design makes it easy to interpret market direction quickly.
Traders can use AFIRMA alone or alongside other indicators to improve trade timing.
Adjustable settings allow for fine-tuning to match various trading styles and timeframes, helping traders capture profitable moves with more confidence and precision.


