About the Daily Turning Point Indicator
The Daily Turning Point Indicator for MT5 is a straightforward trend trading tool built around the daily timeframe.
It plots a single yellow line directly on the price chart to indicate overall market sentiment.
This line acts as a dynamic daily reference level.
When price closes above it, the market shows bullish bias. When price closes below it, bearish pressure dominates.
The concept is simple, which makes it easy to integrate into any trading plan.
The indicator is displayed on the main price area and reacts to daily price shifts.
Traders can adjust the horizontal shift and vertical shift inputs to fine-tune how the line appears on the chart.
It can be used as a standalone directional tool or combined with an oscillator to refine entry timing.
Free Download
dailyturnpoint.mq5 Indicator (MT5)
Key Features
- Single yellow sentiment line on the main price area.
- Daily timeframe based calculation.
- Clear bullish and bearish bias indication.
- Adjustable horizontal shift parameter.
- Adjustable vertical shift parameter.
- Suitable for standalone or combined strategies.
Indicator Chart
The Daily Turning Point Indicator appears on the main price area as a yellow horizontal line that tracks daily sentiment changes.
When candles close above the line, bullish conditions are present. When candles close below it, bearish sentiment takes control.
The line acts as a daily directional filter for trade decisions.

Guide to Trade with the Daily Turning Point Indicator
Buy Rules
- Wait for a candle to close above the yellow daily turning point line.
- Enter a buy trade at the open of the next candle.
- Prefer trades that align with higher timeframe bullish momentum.
Sell Rules
- Wait for a candle to close below the yellow daily turning point line.
- Enter a sell trade at the open of the next candle.
- Prefer trades that align with higher timeframe bearish pressure.
Stop Loss
- For buy trades, place the stop below a recent medium-term support zone.
- For sell trades, place the stop above a recent medium-term resistance zone.
- Alternatively, use the opposite side of the turning point line as a protective reference.
Take Profit
- Set a fixed pip target based on your trading plan.
- Target the next significant support or resistance level.
- Trail the position as long as price remains on the correct side of the yellow line.
- Close the trade if a confirmed opposite candle close occurs.
Daily Turning Point with Xmaster Formula Strategy for MT5
This strategy combines the Daily Turning Point Forex Indicator with the Xmaster Formula Indicator to trade clear directional moves on the H1 timeframe.
It focuses on identifying overall market bias first, then timing entries with momentum confirmation.
The Daily Turning Point acts as a key reference level.
When the candle closes above it, buyers take control and the market leans upward.
When the candle closes below it, selling pressure dominates.
The Xmaster Formula indicator then refines entries with its color-based signals, where the green line reflects bullish momentum and the red line signals bearish conditions.
This approach works best on H1 charts during active sessions, especially London and New York.
It suits traders who prefer fewer but clearer trades, focusing on continuation rather than quick reversals.
Buy Entry Rules
- Wait for price to close above the Daily Turning Point level.
- Confirm that the Xmaster Formula line turns green and starts rising.
- Enter a buy trade at the close of the confirmation candle.
- Place the stop loss below the Daily Turning Point level or the nearest support.
- Take profit when the Xmaster line flattens or turns red, or when price reaches a visible resistance zone.
Sell Entry Rules
- Wait for price to close below the Daily Turning Point level.
- Confirm that the Xmaster Formula line turns red and starts moving downward.
- Enter a sell trade at the close of the confirmation candle.
- Place the stop loss above the Daily Turning Point level or the nearest resistance.
- Take profit when the Xmaster line begins to flatten or turns green, or when price reaches a support area.
Case Study 1 Buy Trade (EURUSD, H1)
During the London session on EURUSD using the H1 timeframe, price moved above the Daily Turning Point and closed strongly above it, signaling a bullish shift.
Shortly after, the Xmaster Formula line turned green and started to slope upward, confirming buying pressure.
A buy trade was opened at the candle close. The stop loss was placed just below the turning point level.
Price continued pushing higher with steady momentum.
After several candles, the Xmaster line changed to red, which prompted the trade exit near a resistance zone.
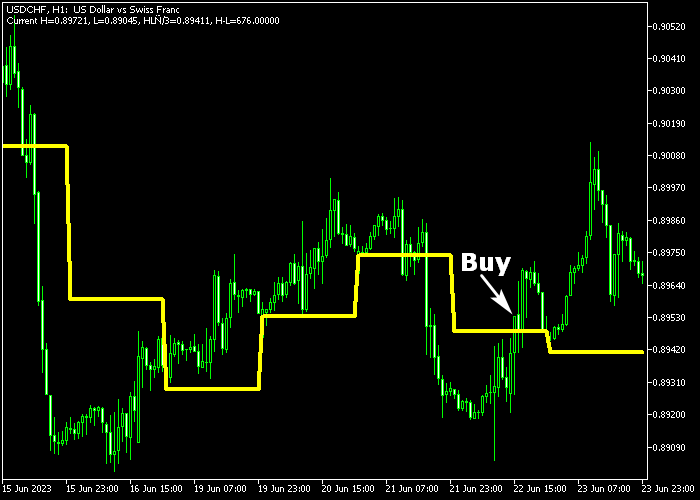
Case Study 2 Sell Trade (USDCHF, H1)
During the New York session on USDCHF using the H1 timeframe, price closed below the Daily Turning Point, indicating bearish control.
The Xmaster Formula line turned red and started pointing downward, confirming the selling momentum.
A sell trade was executed after the confirmation candle. The stop loss was set above the turning point level.
Price declined consistently over the next few hours.
The short trade was closed for 41 pips profit when the Xmaster Formula line shifted from red to green and the candle closed back above the turning point level.
Download Now
dailyturnpoint.mq5 Indicator (MT5)
FAQ
What does the yellow line represent?
The yellow line represents the daily turning point level that defines bullish or bearish market sentiment based on candle closes.
Can I adjust the position of the line?
Yes, you can modify the horizontal and vertical shift settings to reposition the line visually.
Is this indicator suitable for intraday trading?
Yes, many traders apply it on lower timeframes while keeping the daily bias as a directional filter.
Can it be combined with other indicators?
Yes, pairing it with an overbought or oversold oscillator can improve entry precision while keeping the daily bias intact.
Summary
The Daily Turning Point Indicator for MT5 offers a simple and effective way to determine daily market direction.
Its single yellow sentiment line keeps analysis focused and objective.
By defining bullish and bearish bias through candle closes, it supports disciplined trend trading.
Traders can use it alone for directional guidance or combine it with momentum tools for more refined entries.


