
About the BBands Stop V1 Indicator
The BBands Stop V1 Indicator for MT5 is a non-repainting trend reversal tool built around Bollinger Bands logic.
It tracks volatility expansion and contraction to define potential turning points in the market.
The indicator plots an alternating green and orange signal line directly on the price chart.
When the line turns green, it reflects bullish market sentiment. When it switches to orange, it signals bearish pressure.
Because it is based on Bollinger Bands calculations, it adapts to changing volatility conditions.
Traders can customize the Bollinger Bands period, deviation, offset factor, display signals mode, and line settings.
This flexibility allows you to adjust sensitivity for scalping, intraday, or swing trading.
The indicator works effectively as a standalone buy and sell tool, yet it can also be combined with additional technical analysis methods for stronger confirmation.
Free Download
bbands_stop_v1.mq5 Indicator (MT5)
Key Features
- Non-repainting trend reversal signals.
- Green line for bullish conditions.
- Orange line for bearish conditions.
- Bollinger Bands based volatility calculation.
- Customizable period, deviation, and offset factor.
- Suitable for all currency pairs and timeframes.
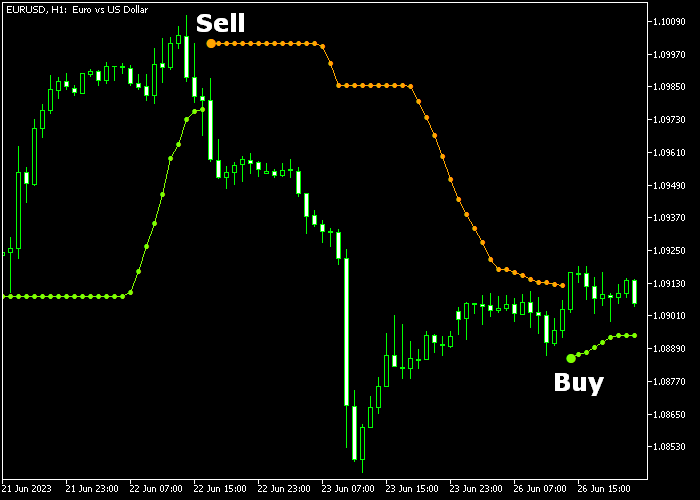
Indicator Chart
The BBands Stop V1 Indicator is displayed on the main price area as a color-changing signal line that follows market direction.
Green segments appear during upward phases and highlight bullish continuation or reversal opportunities.
Orange segments mark bearish phases and potential downside reversals. Each color transition signals a shift in momentum.
Guide to Trade with BBands Stop V1 Indicator
Buy Rules
- Wait for the signal line to turn green on the chart.
- Confirm the candle closes with the green line fully visible.
- Enter a buy trade at the start of the next candle.
- Prefer entries that align with broader bullish market pressure.
Sell Rules
- Wait for the signal line to turn orange on the chart.
- Confirm the candle closes with the orange line fully visible.
- Enter a sell trade at the start of the next candle.
- Prefer entries that align with broader bearish market pressure.
Stop Loss
- For buy trades, place the stop below the green line
- For sell trades, place the stop above the orange line.
Take Profit
- Close the buy trade when the line switches from green to orange.
- Close the sell trade when the line switches from orange to green.
- Alternatively, target a minimum risk to reward ratio of 1.5.
BBands Stop V1 Indicator Scalping Strategy for MT5
This scalping strategy combines the BBands Stop V1 Indicator MT5 with the Dark Inversion Indicator MT5.
It is designed for fast paced trading during the London and US sessions, where volatility and liquidity create strong short term opportunities.
The BBands Stop V1 Indicator tracks trend direction using a dynamic signal line.
The Dark Inversion Indicator adds precise entry timing by printing green arrows for buy signals and red arrows for sell signals.
Combining these tools allows traders to follow the trend while entering at optimal moments.
This strategy works best on M1 and M5 charts during active sessions.
It focuses on quick entries and exits, making it suitable for traders who prefer short holding times and clear confirmation signals.
Buy Entry Rules
- Confirm that the BBands Stop V1 signal line has turned green, indicating a bullish trend.
- Wait for a green arrow from the Dark Inversion Indicator to appear.
- Enter a buy trade at the open of the next candle after the signal.
- Place the stop loss a few pips below the recent swing low or below the signal candle.
- Take profit when the BBands Stop line turns orange or when a red arrow appears, or close near a short term resistance level.
Sell Entry Rules
- Confirm that the BBands Stop V1 signal line has turned orange, indicating a bearish trend.
- Wait for a red arrow from the Dark Inversion Indicator to appear.
- Enter a sell trade at the open of the next candle after the signal.
- Place the stop loss a few pips above the recent swing high or above the signal candle.
- Take profit when the BBands Stop line turns green or when a green arrow appears, or close near a short term support level.
Case Study 1: EUR/USD M5 London Session Buy
During the London session on EUR/USD M5, the BBands Stop V1 line turned green, signaling a shift into a bullish trend.
Shortly after, the Dark Inversion Indicator printed a green arrow, confirming a buy opportunity.
A new buy trade was entered at the next candle open.
Price moved upward quickly as momentum increased during the session.
The position was closed when the BBands Stop line began to turn orange, capturing a fast scalping profit within a strong move.
Case Study 2: GBP/USD M1 US Session Sell
On GBP/USD M1 during the US session, the BBands Stop V1 line turned orange, indicating bearish pressure.
A red arrow from the Dark Inversion Indicator appeared shortly after, confirming a sell setup.
A sell trade was entered at the next candle open.
Price dropped rapidly as volatility increased.
The trade was closed when a green arrow appeared, signaling a potential bullish trend reversal.
Download Now
bbands_stop_v1.mq5 Indicator (MT5)
FAQ
How does the offset factor affect signals?
The offset factor adjusts how closely the signal line follows the price.
A smaller offset increases responsiveness, while a larger value smooths fluctuations.
Which Bollinger Bands settings work best?
Shorter periods create more frequent signals suited for lower timeframes.
Longer periods reduce noise and fit higher timeframe trading.
Can this indicator be used alone?
Yes, it functions as a standalone reversal tool.
Many traders also combine it with support and resistance or trend confirmation tools for added confidence.
Summary
The BBands Stop V1 Indicator delivers reliable trend reversal signals based on adaptive Bollinger Bands calculations.
Its non-repainting signal line keeps decision making objective and consistent.
With adjustable parameters and straightforward color transitions, it adapts to different trading styles and volatility conditions.
Traders can use it to capture early reversals or stay aligned with developing trends across multiple timeframes.


