
About the Daily Range Indicator
The Daily Range indicator for MT5 is a volatility-based technical tool designed to map price fluctuations within a specific trading session.
It functions by calculating and plotting a red and blue boundary line that connects the daily high and low prices.
These levels act as dynamic corridors that encapsulate price action, allowing traders to observe the relationship between current movement and the established daily extremes.
The indicator appears directly on the main price chart, providing an immediate overview of the market bias.
It distinguishes between hollow bullish candles and filled bearish candles, helping traders quickly identify who is in control of the session.
Free Download
dailyrange.mq5 Indicator (MT5)
Key Features
- The indicator connects daily extremes with colored lines to define the active trading range.
- It uses a unique candle style where hollow bodies represent buying and filled bodies represent selling.
- Traders can modify specific input parameters for the daily range up and down levels.
- The visual layout is optimized to display the current trend without obstructing price action.
- It serves as an excellent tool for identifying breakout opportunities once price hits the boundaries.
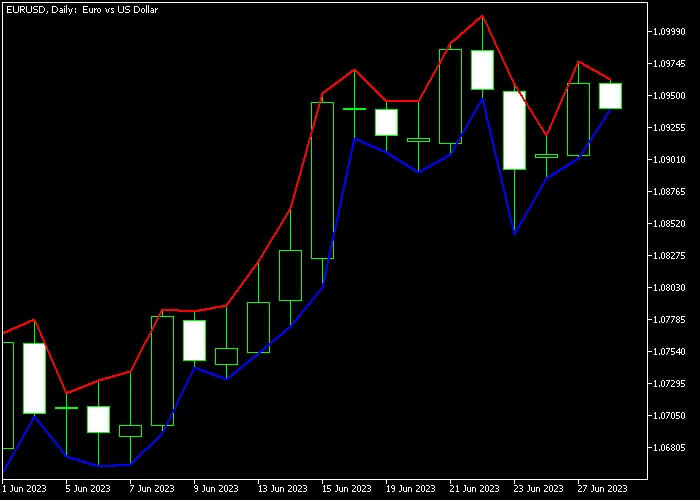
Indicator Chart
The chart features the Daily Range indicator with its boundary lines wrapping the price candles.
The red line tracks the upper levels while the blue line monitors the lower extremes, creating a clear visual zone for the day.
Traders can use these levels to spot trend strength and potential reversal points at the edges of the range.
Guide to Trade with the Daily Range Indicator
Buy Rules
- Wait for the price to establish a support base near the blue lower range line.
- Ensure a hollow bullish candle closes after touching the lower boundary.
- Confirm that the overall market structure is favoring an upward movement.
- Open a buy market order at the start of the next session.
Sell Rules
- Identify price exhaustion as it approaches the red upper range line.
- Watch for a filled bearish candle to close near the top of the range.
- Verify that the resistance level is holding firm against further advances.
- Execute a sell transaction immediately following the bearish candle close.
Stop Loss
- Place the stop loss for buy trades a few pips below the red lower line.
- Set the stop loss for sell trades slightly above the blue upper line.
Take Profit
- Close the buy trade if the price hits the upper red range boundary.
- Close the sell trade if the price hits the lower blue range boundary.
- Alternative: set a fixed target based on the average daily pip movement.
Daily Range Scalping Strategy for MT5 with Clever Forex Scalper
This scalping strategy combines the Daily Range Indicator with the Clever Forex Scalper Indicator to create a structured approach to short-term trading.
The Daily Range highlights key intraday boundaries, while the scalper arrows provide precise entry timing.
The idea behind this setup is simple.
Price often reacts at the edges of its daily range, either bouncing from support or reversing from exhaustion near resistance.
Range-based tools help define these zones clearly, allowing traders to align entries with realistic price movement expectations.
This strategy works best on M1 and M5 timeframes.
It fits traders who want quick trades with defined targets and minimal exposure to market noise.
The London and New York sessions typically provide the strongest signals due to increased volatility.
Buy Entry Rules
- Look for price to stabilize and form a base around the blue lower range level before considering a buy.
- Look for confirmation from the Clever Forex Scalper with a blue arrow.
- Enter a buy trade at the close of the signal candle.
- Place the stop loss slightly below the recent swing low or below the range line.
- Close the trade when a red arrow appears or when price approaches the upper daily range boundary.
Sell Entry Rules
- Watch for price to reach the red upper range level and begin losing momentum as a sign of a potential sell.
- Confirm the setup with a red arrow from the Clever Forex Scalper.
- Enter a sell trade at the close of the signal candle.
- Place the stop loss above the recent swing high or slightly above the range line.
- Close the trade when a blue arrow appears or when price returns toward the lower range boundary.
Case Study 1: USDJPY M1
On the USDJPY M1 timeframe, price moved downward early in the session and found support near the blue lower range line.
The market began forming small bullish candles, indicating a base.
Shortly after, a blue arrow appeared from the Clever Forex Scalper, confirming the upward move.
A buy trade was entered and price reacted quickly, bouncing toward the mid-range area.
The trade was closed as price neared the upper range boundary, capturing a fast scalping move.
Case Study 2: GBPUSD M5
On the GBPUSD M5 timeframe, price climbed steadily before reaching the red upper range line.
Momentum slowed and several rejection candles formed, signaling exhaustion.
A red arrow appeared from the Clever Forex Scalper, confirming a sell opportunity.
A short position was opened and price dropped gradually back toward the lower range zone.
The trade was closed for 24 pips when a blue arrow appeared, indicating a trend reversal.
Download Now
dailyrange.mq5 Indicator (MT5)
FAQ
How does the Daily Range indicator help in identifying a trend?
The indicator highlights the trend by observing where the majority of candle closes occur relative to the boundary lines.
If price consistently stays near the upper blue line with hollow candles, a bullish trend is active.
Conversely, price hugging the red lower line with filled candles indicates a bearish environment.
Does this tool work on timeframes lower than the daily chart?
While the indicator is designed to calculate the daily range, it can be viewed on lower timeframes like H1 or M15 to see how price moves within those daily boundaries.
This is especially helpful for day traders looking for entries at the extremes of the daily price action.
Summary
The Daily Range indicator provides a simplified perspective on market volatility by framing price action within established daily boundaries.
It helps traders maintain objective discipline by highlighting exactly where a pair is trading relative to its high and low extremes.
This indicator serves as an effective filter for identifying when a trend has reached exhaustion or is preparing for a breakout.
Consistent use of this tool can significantly improve a trader’s ability to stay on the right side of daily momentum.


