About the Pattern Recognition Master Indicator
The Pattern Recognition Master Indicator for MT5 identifies key bullish and bearish single candlestick patterns directly on the chart, helping traders pinpoint high-probability trade entries in the direction of the overall trend.
Recognized bullish patterns include Bullish Hammer, Morning Star, Morning Doji Star, Piercing Line, and Bullish Engulfing Pattern.
Bearish patterns include Shooting Star, Evening Star, Evening Doji Star, Dark Cloud Pattern, and Bearish Engulfing Pattern. Each pattern is color-coded for easy recognition on the chart.
Traders can customize the display of patterns, colors, and style according to preference.
It works across all instruments and timeframes supported by MT5, making it versatile for Forex, commodities, indices, and stocks.
Free Download
pattern-recognition.mq5 Indicator (MT5)
Key Features
- Automatically identifies bullish and bearish candlestick patterns.
- Color-coded patterns for quick recognition: blue for bullish, red for bearish.
- Customizable pattern display, colors, and style.
- Helps improve entry timing aligned with the market trend.
- Can be combined with other technical indicators to enhance trading accuracy.
Indicator Chart
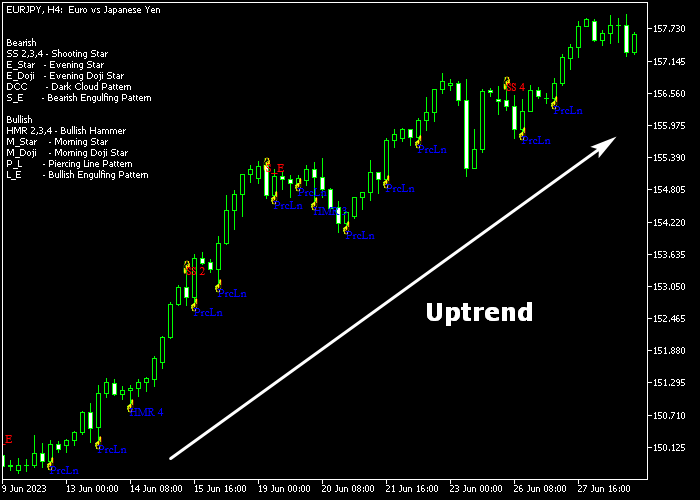
The Pattern Recognition Master Indicator overlays bullish and bearish candlestick patterns directly on the main price chart.
Blue colored patterns indicate bullish setups, while red colored patterns indicate bearish setups.
The chart visually guides traders to potential entry points in line with the prevailing trend.

Guide to Trade with Pattern Recognition Master Indicator
Buy Rules
- Confirm the market is in a clear uptrend.
- Open a buy trade when a bullish candlestick pattern (blue) is displayed on the chart.
- Ensure the pattern forms at a reasonable support level or during upward momentum.
- Do not enter if the price shows signs of exhaustion or overextension.
Sell Rules
- Confirm the market is in a clear downtrend.
- Open a sell trade when a bearish candlestick pattern (red) is displayed on the chart.
- Ensure the pattern forms near resistance or during strong downward momentum.
- Avoid selling if the price appears oversold or the trend is weakening.
Stop Loss
- For buy trades, place the stop loss below the low of the pattern candle or recent swing low.
- For sell trades, place the stop loss above the high of the pattern candle or recent swing high.
- Adjust stop distance based on volatility and timeframe.
Take Profit
- Close buy trades based on your exit strategy or when the price reaches resistance levels.
- Close sell trades based on your exit strategy or when the price reaches support levels.
- Exit the open trade when an opposite signal appears on the chart.
- Monitor market momentum to decide whether to hold or exit early.
Pattern Recognition Master Price Action MT5 Strategy with Super Arrow Buy Sell
This price action strategy combines the Pattern Recognition Master Indicator with the Super Arrow Buy Sell Indicator to capture trend reversals and continuation moves based on candlestick patterns.
The Pattern Recognition Master identifies key bullish and bearish reversal patterns, while the Super Arrow provides trend confirmation with clear arrow signals.
Using both together allows traders to enter trades with better timing and confidence.
This strategy is best applied on M15, M30, and H1 charts.
It is ideal for traders who focus on price action and want to combine pattern recognition with trend confirmation for cleaner entries.
Buy Entry Rules
- Wait for the Super Arrow to display a blue arrow, signaling bullish trend momentum.
- Check the Pattern Recognition Master for a recognized bullish pattern such as Bullish Hammer, Morning Star, Morning Doji Star, Piercing Line, or Bullish Engulfing Pattern.
- Enter a buy trade at the close of the candle forming the bullish pattern.
- Set a stop loss below the lowest point of the bullish pattern.
- Take profit when the Super Arrow turns red or when a key resistance level is reached.
- Alternatively, close when a bearish pattern is recognized.
Sell Entry Rules
- Wait for the Super Arrow to display a red arrow, indicating bearish trend momentum.
- Look for a recognized bearish pattern such as Shooting Star, Evening Star, Evening Doji Star, Dark Cloud Pattern, or Bearish Engulfing Pattern from the Pattern Recognition Master.
- Enter a sell trade at the close of the candle forming the bearish pattern.
- Place the stop loss above the highest point of the bearish pattern.
- Take profit when the Super Arrow turns blue or when a key support level is reached.
- You can also close when a bullish pattern appears.
Case Study 1: EURUSD M15
On the EURUSD M15 chart, a Bullish Engulfing Pattern was identified by the Pattern Recognition Master.
At the same time, the Super Arrow showed a blue arrow confirming the bullish trend.
A buy trade was entered at the close of the engulfing candle with the stop loss below the candle’s low.
Price moved upward steadily, reaching the next resistance level.
The trade was closed when the Super Arrow signaled a bearish trend with a red arrow, capturing a strong intraday price action move.
Case Study 2: GBPJPY M30
On GBPJPY M30, a Shooting Star pattern appeared, recognized by the Pattern Recognition Master.
Simultaneously, the Super Arrow indicated a red arrow confirming bearish momentum.
A sell trade was opened at the close of the pattern candle with the stop loss above its high.
Price declined sharply toward a nearby support level.
The position was closed when the Super Arrow signaled a bullish trend, locking in a clean intraday profit.
Download Now
pattern-recognition.mq5 Indicator (MT5)
FAQ
Can I customize the colors of candlestick patterns?
Yes. Both bullish and bearish pattern colors can be adjusted, along with whether patterns are displayed at all.
Should I use this indicator alone?
It can generate entries independently, but combining it with trend confirmation or other technical indicators increases trading reliability.
How reliable are the patterns?
Pattern reliability depends on the market trend and timeframe. Testing on a demo account helps gauge effectiveness.
Summary
The Pattern Recognition Master Indicator identifies key bullish and bearish candlestick patterns to guide trend-aligned trading entries.
Blue patterns signal bullish setups, while red patterns indicate bearish setups.
Customizable settings, combined with trend analysis, make it a practical tool for improving entry timing.
Traders can integrate it with other indicators or strategies to enhance accuracy and manage trades with appropriate stop loss and take profit levels.


