About the MAMA Indicator
The MAMA indicator for MT5 identifies strong currency trends using the MAMA and FAMA lines.
It works on a simple crossover principle to signal buy and sell opportunities.
A bullish trend occurs when the MAMA line crosses above the FAMA line from below.
A bearish trend occurs when the MAMA line crosses below the FAMA line from above.
This makes it easy to spot potential trend changes and align trades with the market direction.
Traders can customize the colors of both MAMA and FAMA lines to improve chart readability.
Free Download
Key Features
- Two-line system using MAMA and FAMA crossovers.
- Signals bullish and bearish trends based on line intersections.
- Customizable colors for MAMA and FAMA lines.
- Compatible with all MT5-supported instruments and timeframes.
- Helps traders detect trend reversals and continuation patterns.
- Simple to use for both beginners and experienced traders.
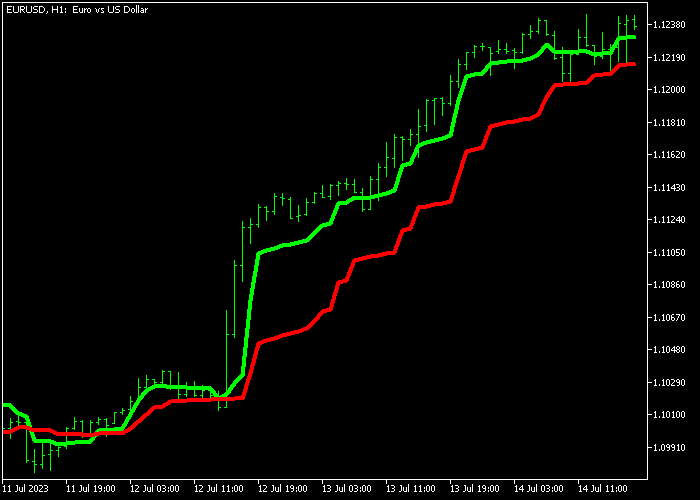
Indicator Chart
The MAMA Indicator shows two lines in the main chart area.
Green represents MAMA, and red represents FAMA. Crossovers generate buy or sell signals depending on the direction of the intersection.
Traders can monitor these crossovers to determine trend direction and anticipate potential market movements for precise entry points.

Guide to Trade with the MAMA Indicator
Buy Rules
- Enter a buy trade when the green MAMA line crosses above the red FAMA line from below.
- Confirm that the trend is supported by recent higher lows or other trend indicators.
- Look for sustained bullish momentum after the crossover before entering.
Sell Rules
- Enter a sell trade when the green MAMA line crosses below the red FAMA line from above.
- Confirm that the trend is supported by recent lower highs or other trend indicators.
- Wait for sustained bearish momentum after the crossover before entering.
Stop Loss
- For buy trades, place the stop loss just below the most recent support low.
- For sell trades, place the stop loss just above the most recent resistance high.
- Use trailing stops along the trend for added protection as the trade moves favorably.
Take Profits
- For buy trades, close all buy trades when the green MAMA line crosses the red FAMA line top down.
- For sell trades, close all sell trades when the green MAMA line crosses the red FAMA line bottom up.
- Optionally, go for a fixed pip target of your choice.
MAMA and Stochastic with Support/Resistance MT5 Scalping Strategy
This scalping strategy combines trend-following crossovers with overbought and oversold levels to capture quick intraday gains.
It uses the MAMA Indicator MT5 for trade entries and the Stochastic Indicator with Support/Resistance for MT5 to determine take profit points.
The MAMA indicator features two lines: the green MAMA line and the red FAMA line for buy and sell entries.
The Stochastic with Support/Resistance indicator identifies potential exit points.
Blue readings show overbought conditions, suggesting the price may soon reverse, while orange readings indicate oversold conditions.
These readings allow scalpers to capture gains efficiently and exit trades near short-term reversals.
This strategy is best applied on M1 and M5 charts during high-activity sessions.
It works well on major currency pairs and liquid commodities where short-term price swings are frequent.
Buy Entry Rules
- Wait for the green MAMA line to cross above the red FAMA line from below, signaling a buy.
- Enter a buy trade at the open of the next candle following the crossover.
- Place the stop loss below the recent swing low or just under the nearest support level.
- Take profit when the Stochastic indicator shows blue readings, indicating overbought conditions, or when a short-term reversal is observed.
Sell Entry Rules
- Wait for the green MAMA line to cross below the red FAMA line from above, signaling a sell.
- Enter a sell trade at the next candle open after the crossover.
- Set the stop loss above the recent swing high or slightly above the nearest resistance level.
- Take profit when the Stochastic indicator shows orange readings, indicating oversold conditions, or when a short-term bounce occurs.
Case Study 1: USD/JPY M1 Scalping
During the London session, USD/JPY showed the green MAMA line crossing above the red FAMA line after a brief pullback.
A buy trade was placed at the next candle, with the stop loss below the recent swing low.
The price moved quickly higher, and the trade was exited when the Stochastic indicator entered overbought territory, capturing 8 pips.
Case Study 2: EUR/USD M5 Scalping
On the M5 chart, EUR/USD saw the green MAMA line cross below the red FAMA line, signaling a sell opportunity.
A short position was opened at the next candle with the stop loss above the recent swing high.
Price declined steadily, and the trade was closed as the Stochastic showed oversold readings, securing 15 pips.
Download Now
FAQ
What is the main purpose of the MAMA Indicator?
It identifies bullish and bearish trends using the crossover of MAMA and FAMA lines. This helps traders enter trades with the trend.
Can I customize the lines’ colors?
Yes. Both MAMA and FAMA lines can be colored according to your preference for better chart visibility.
How can I reduce false signals with MAMA?
Combine MAMA with trend or momentum indicators. Also, confirm trades by checking recent swing highs/lows or overall market direction before entering.
Summary
The MAMA Forex Indicator uses crossovers between MAMA and FAMA lines to detect bullish and bearish trends.
Green above red signals a buy, while green below red signals a sell.
Its simplicity, customizable visuals, and compatibility with all instruments and timeframes make it suitable for beginners and experienced traders alike.
By monitoring crossovers and supporting trend confirmation, traders can time entries and exits more effectively.


