
About the Harmonic Pattern Indicator with Signals
The Harmonic Pattern Indicator with Signals for MT5 automatically detects advanced harmonic reversal formations and provides complete trading levels.
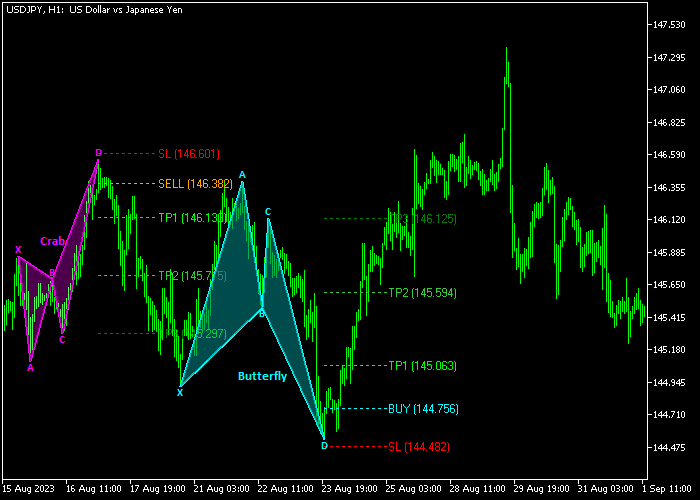
It identifies Gartley, Butterfly, Bat, and Crab patterns directly on the price window and plots entry, stop loss, and multiple take profit targets.
Each pattern is calculated using precise Fibonacci ratios between the X, A, B, C, and D points.
When these ratios align, the indicator marks a potential reversal zone and displays the suggested SL, TP1, TP2, and TP3 levels.
This tool works on all currency pairs and time frames.
Traders can enable or disable specific patterns such as Gartley, Crab, Butterfly, or Bat from the settings panel.
Color and transparency options allow full visual customization based on personal preference.
Free Download
Basic Harmonic Pattern MT5.ex5 Indicator (MT5)
Key Features
- Automatically detects Gartley, Bat, Crab, and Butterfly patterns.
- Displays X, A, B, C, and D points with precise Fibonacci ratios.
- Provides ready-to-use entry, stop loss, and three take profit levels.
- Allows enabling or disabling specific harmonic patterns.
- Fully customizable colors and transparency settings.
Indicator Chart
The Harmonic Pattern Indicator with Signals plots completed harmonic formations directly on the price window.
Once a pattern reaches point D, the indicator projects entry, SL, and TP levels.
Bullish patterns highlight potential upward reversals, while bearish patterns signal possible downward turning points.
Guide to Trade with Harmonic Pattern Indicator with Signals
Buy Rules
- Wait for a completed bullish harmonic pattern at point D.
- Confirm price shows rejection near the projected reversal zone.
- Execute a buy trade at the suggested entry level.
- Follow the SL and TP levels provided by the indicator.
Sell Rules
- Wait for a completed bearish harmonic pattern at point D.
- Confirm price shows rejection near the projected reversal zone.
- Execute a sell trade at the suggested entry level.
- Follow the SL and TP levels provided by the indicator.
Stop Loss
- Use the stop loss level projected by the harmonic pattern.
- Do not widen the stop beyond the pattern invalidation point.
- Avoid moving the stop prematurely unless market conditions shift.
Take Profits
- Close partial positions at TP1 to secure early gains.
- Hold the remaining volume toward TP2 for extended moves.
- Target TP3 if momentum supports a full reversal.
- Alternatively, exit fully if price shows strong rejection before TP levels.
Harmonic Pattern and TTM Trend MT5 Day Trading Strategy
This day trading strategy combines the Harmonic Pattern Indicator with Signals for MT5 and the TTM Trend Indicator for MT5 to identify high-probability intraday reversal setups.
The Harmonic Pattern indicator provides precise reversal signals at point D, with bullish patterns signaling potential buy trades and bearish patterns signaling sell trades.
The TTM Trend indicator confirms the overall market direction using colored candles: blue for bullish trends and light-brown for bearish trends.
Combining pattern recognition with trend confirmation allows traders to enter trades with both structural and momentum validation.
This strategy works best on 15-minute and 1-hour charts.
Buy Entry Rules
- Wait for a completed bullish harmonic pattern to form at point D on the chart.
- Confirm the trend using the TTM Trend indicator. Blue candles must be visible, indicating a bullish trend.
- Open a buy trade immediately after the bullish pattern completion while the trend remains bullish.
- Place the stop loss just below the low of point D to protect against invalidation of the pattern.
- Set the take profit near the next resistance level or previous swing high.
- Optionally, scale out partial profit when price reaches 50% of the measured move and let the remainder run.
- Close the trade early if TTM Trend candles turn light-brown or if price breaks below point D.
Sell Entry Rules
- Wait for a completed bearish harmonic pattern to form at point D on the chart.
- Confirm the trend using the TTM Trend indicator. Light-brown candles must be visible, indicating a bearish trend.
- Open a sell trade immediately after the bearish pattern completion while the trend remains bearish.
- Place the stop loss just above the high of point D to protect against pattern failure.
- Set the take profit near the next support level or previous swing low.
- Consider taking partial profit at 50% of the expected move and letting the remainder run if momentum continues.
- Exit early if TTM Trend candles turn blue or if price breaks above point D.
Cast Study 1
On the EUR/JPY M15 chart, a bullish Gartley harmonic pattern completed at point D.
The TTM Trend indicator displayed blue candles, confirming a bullish trend.
A buy trade was entered with the stop loss placed just below point D.
Price moved upward and reached the first resistance level, achieving partial profit.
The remainder of the position trailed the trend and closed near the next swing high, providing a controlled and precise day trading setup.
Cast Study 2
On the GBP/USD H1 chart, a bearish Bat harmonic pattern formed at point D.
The TTM Trend indicator showed light-brown candles, confirming a bearish trend.
A sell trade was opened with the stop loss set above point D.
Price declined steadily, reaching the first support level where partial profit was taken.
The remaining position followed the downtrend and exited near the next swing low.
Download Now
Basic Harmonic Pattern MT5.ex5 Indicator (MT5)
FAQ
What makes harmonic patterns reliable?
Harmonic patterns rely on strict Fibonacci ratios between price swings.
When these ratios align precisely, they often indicate exhaustion and potential reversal zones.
Can I disable certain patterns?
Yes, you can enable or disable Gartley, Crab, Butterfly, or Bat patterns individually in the settings menu.
Do the signals repaint after completion?
Once point D is confirmed and the pattern is completed, the levels remain fixed. However, incomplete patterns may adjust until fully formed.
Which time frame works best?
The indicator works on all time frames.
Higher time frames often produce stronger reversal setups, while lower time frames provide more frequent signals.
Summary
The Harmonic Pattern Indicator with Signals for MT5 gives traders a structured way to trade advanced Fibonacci-based reversals.
It eliminates manual measurement and delivers ready-to-use SL and TP projections.
With customizable pattern selection and full trade management levels, it supports both conservative and aggressive trading approaches.
Traders who respect pattern completion and risk control can use it to capture high-quality reversal setups.


