About the Fibonacci Channel Indicator
The Fibonacci Channel indicator for MT5 is a price action tool that automatically plots Fibonacci retracement levels across the chart using a channel-based structure.
It helps traders identify potential areas where the market may pause, reverse, or continue trending.
The indicator draws several commonly used Fibonacci levels such as -0.786, -0.618, -0.500, -0.382, and -0.236.
In trending markets, the Fibonacci Channel is frequently used to locate pullback opportunities.
When the market moves strongly in one direction, price often retraces toward one of the Fibonacci levels before continuing the main trend.
Among these levels, the -0.382 retracement is one of the most closely watched by traders.
Free Download
Fibonacci_Channel.mq5 Indicator (MT5)
Key Features
- Automatically plots Fibonacci retracement levels on the price area.
- Includes common Fibonacci levels such as -0.786, -0.618, -0.500, -0.382, and -0.236.
- Helps identify potential pullback zones within trending markets.
- Useful for both buy on dips and sell on rallies strategies.
- Supports multiple timeframes for flexible analysis.
- Helps traders visualize dynamic support and resistance areas.
- Based on widely used Fibonacci price analysis methods.
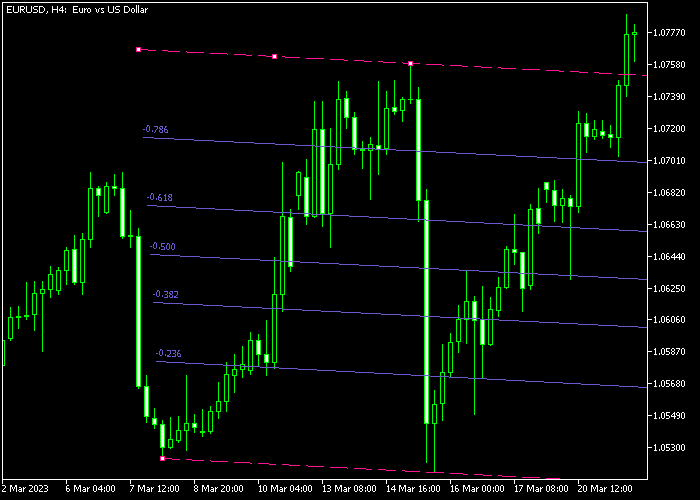
Indicator Chart
The Fibonacci Channel indicator appears on the main price area and plots several Fibonacci retracement levels that move along the market trend.
In the example, price reacts around the -0.382 Fibonacci level, which often acts as a pullback zone before the trend continues.

Guide to Trade with the Fibonacci Channel Indicator
Buy Rules
- Identify that the market is currently moving in an upward trend.
- Wait for price to retrace toward the -0.382 Fibonacci level.
- Observe whether bullish price action appears at this level.
- Open a buy position if the market resumes moving higher.
Sell Rules
- Confirm that the market is moving in a downward trend.
- Wait for price to retrace upward toward the -0.382 Fibonacci level.
- Look for bearish price rejection near the retracement area.
- Enter a sell trade once price starts continuing the downtrend.
Stop Loss
- Place the stop loss slightly beyond the next Fibonacci level.
- Another approach is positioning the stop below the recent swing for buy trades.
- For sell trades, place the stop beyond the latest price rejection zone.
Take Profit
- Target the next Fibonacci level in the direction of the trend.
- Another option is aiming for a reward that is at least twice the risk.
- Close the trade if price begins reversing against the trend.
MT5 Fibonacci Channel Indicator Retracement Strategy
This strategy combines the Fibonacci Channel Indicator with the Tom DeMark Moving Average Indicator to trade pullbacks within a trend.
Fibonacci retracement focuses on identifying temporary pullbacks before the main trend continues.
Price often reacts at key levels such as 0.382 or 0.618, which act as support or resistance zones during a retracement.
In this setup, the Fibonacci Channel highlights dynamic retracement zones, while the Tom DeMark Moving Average confirms the overall trend direction.
The goal is simple. Wait for a clear trend, allow price to retrace into the -0.382 Fibonacci level, and enter when the market resumes in the direction of the trend.
This approach avoids chasing price and instead focuses on structured pullbacks. It works well on M5 and M15 charts.
Buy Entry Rules
- Confirm the Tom DeMark Moving Average is yellow, indicating an uptrend.
- Wait for price to retrace downward toward the -0.382 Fibonacci level on the Fibonacci Channel Indicator.
- Enter a buy trade once price reacts and closes back above the -0.382 level.
- Place the stop loss below the recent swing low or below the next Fibonacci level.
- Close the buy trade when the Tom DeMark Moving Average turns orange or when price closes below the moving average.
- An optional exit can be aligned with the previous swing high before the retracement started.
Sell Entry Rules
- Confirm the Tom DeMark Moving Average is orange, indicating a downtrend.
- Wait for price to retrace upward toward the -0.382 Fibonacci level on the Fibonacci Channel Indicator.
- Enter a sell trade once price reacts and closes back below the -0.382 level.
- Place the stop loss above the recent swing high or above the next Fibonacci level.
- Close the sell trade when the Tom DeMark Moving Average turns yellow or when price closes above the moving average.
- An optional exit can be placed near the most recent lower low formed before the pullback.
Case Study 1: NZDUSD M5 Buy Trade
On NZDUSD M5, the Tom DeMark Moving Average turned yellow, confirming bullish direction.
Price then pulled back toward the -0.382 Fibonacci level within the channel.
Shortly after, price rejected the level and closed back above it.
A buy trade was entered after the confirmation candle closed. The stop loss was placed below the recent swing low.
25 candles later, the Tom DeMark Moving Average turned orange.
The buy trade was closed at that moment based on the moving average indicating a trend change.
Case Study 2: EURJPY M15 Sell Trade
On EURJPY M15, the Tom DeMark Moving Average was orange, confirming a downtrend.
Price retraced upward toward the -0.382 Fibonacci level.
Two candles later, price rejected that level and closed back below it.
A sell trade was entered after the signal candle closed. The stop loss was placed above the recent swing high.
Two hours later, price crossed and closed above the Tom DeMark Moving Average.
The sell trade was closed at that point based on the moving average signaling a reversal.
Download Now
Fibonacci_Channel.mq5 Indicator (MT5)
FAQ
What does the Fibonacci Channel indicator display?
The indicator automatically plots several Fibonacci retracement levels on the chart, helping traders identify potential pullback areas and trend continuation zones.
Why is the -0.382 level important?
The -0.382 Fibonacci level is widely used by traders because price often reacts at this level during trend pullbacks.
Can the indicator be used on all markets?
Yes. The Fibonacci Channel indicator works on any instrument available on the MetaTrader 5 platform, including forex pairs, commodities, and indices.
What type of strategy works best with this indicator?
The indicator is commonly used in trend-following strategies where traders buy pullbacks in uptrends or sell rallies in downtrends.
Summary
The Fibonacci Channel indicator is a practical tool for traders who rely on Fibonacci retracement levels to analyze price behavior.
Because the indicator focuses on trend retracements, it can be useful for traders who prefer trading with the direction of the market rather than against it.
Combined with price action confirmation, the Fibonacci Channel indicator can assist traders in finding structured pullback opportunities within trending markets.


