
About the Kijun Sen with Alerts Indicator
The Kijun Sen with Alerts indicator for MT5 tracks the Kijun-sen line from the Ichimoku system.
It calculates the average of the highest and lowest prices over a defined period to show trend direction.
Traders watch for candle crossings of the line, which signal potential trend changes.
The line switches between deep sky blue for uptrends and sandy brown for downtrends, giving a visual signal of market direction.
Alerts notify traders when the trend shifts, making it easier to enter or exit positions promptly.
This indicator suits traders working in trending markets and can be adapted to different timeframes and strategies.
Free Download
Key Features
- Displays the Kijun-sen line as deep sky blue for bullish trends and sandy brown for bearish trends.
- Sends alerts when the trend changes or a new bar forms, improving trade timing.
- Customizable calculation period to fit different market strategies.
- Provides clear signals for entering and exiting trades in trending markets.
- Works on multiple timeframes, suitable for scalpers and swing traders.
Indicator Chart
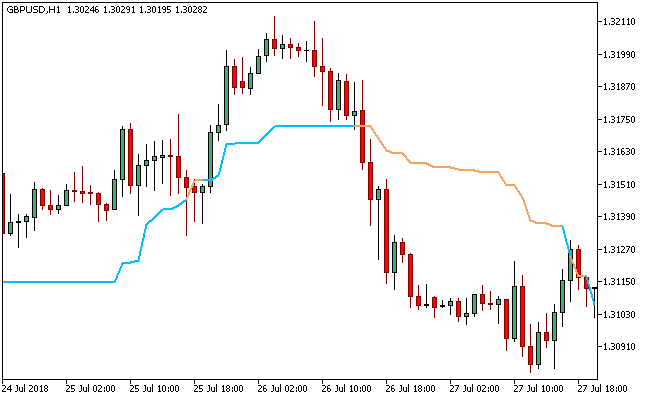
The Kijun Sen with Alerts indicator appears directly on the main price area. The chart shows buy and sell signals as the line changes color.
Deep sky blue signals a potential long entry while sandy brown signals a potential short.
Traders can follow trend shifts in real time using the alert notifications.
Guide to Trade with Kijun Sen with Alerts Indicator
Buy Rules
- Enter a long trade when the Kijun Sen line turns deep sky blue.
- Confirm that the price is trading slightly above the line.
- Consider aligning with the overall market trend for higher accuracy.
- Monitor alerts for early notification of trend continuation.
Sell Rules
- Enter a short trade when the Kijun Sen line turns sandy brown.
- Ensure the price is slightly below the line before entering.
- Use trend context from higher timeframes to confirm entries.
- Watch for alerts to track new bearish movements.
Stop Loss
- Place the stop loss below the deep sky blue line for buy trades.
- Place the stop loss above the sandy brown for sell trades.
- Trail the stop loss just below the Kijun Sen line for buy trades and above the line for sell trades as the trend progresses.
Take Profit
- Close all buy orders if the deep sky blue line turns sandy brown.
- Close all sell orders if the sandy brown line turns deep sky blue.
- Use alerts to monitor potential trend reversals for taking profits.
Kijun Sen With Alerts MT5 Swing Strategy with Rahul Mohindar Oscillator
This swing trading strategy combines a dynamic trend baseline with momentum confirmation to capture sustained price movements.
The Kijun Sen With Alerts indicator defines the prevailing trend through color shifts, while the Rahul Mohindar Oscillator confirms entries using momentum strength.
The Kijun Sen is derived from the midpoint of recent highs and lows, making it a reliable reference for trend direction and dynamic support or resistance.
In this setup, deep sky blue signals bullish conditions and sandy brown signals bearish conditions.
The Rahul Mohindar Oscillator uses histogram movement around the zero line to show momentum strength, with values above zero indicating bullish pressure and below zero indicating bearish pressure.
This strategy is designed for H1 and H4 charts and suits swing traders who prefer holding positions over multiple sessions.
It works effectively on pairs with clear directional movement such as EURJPY, AUDUSD, and GBPJPY.
Buy Entry Rules
- The Kijun Sen line is deep sky blue, confirming a bullish trend.
- Price remains above the Kijun Sen and respects it as support.
- The Rahul Mohindar Oscillator prints a green histogram bar above the zero level.
- Enter a buy trade at the close of the confirmation candle.
- Place a stop loss below the Kijun Sen line with an additional buffer below the recent support level.
- Close the trade when the Rahul Mohindar Oscillator prints a red histogram bar below the zero level.
Sell Entry Rules
- The Kijun Sen line is sandy brown, confirming a bearish trend.
- Price remains below the Kijun Sen and respects it as resistance.
- The Rahul Mohindar Oscillator prints a red histogram bar below the zero level.
- Enter a sell trade at the close of the confirmation candle.
- Set the stop loss above the Kijun Sen line with an additional buffer above the recent resistance level.
- Close the trade when the Rahul Mohindar Oscillator prints a green histogram bar above the zero level.
Case Study 1: EURJPY H1 Swing Trade
On EURJPY H1, the Kijun Sen turned deep sky blue and price held above it during a steady upward move.
The Rahul Mohindar Oscillator printed a green histogram bar above zero, confirming bullish momentum.
A buy trade was opened at candle close with a stop loss placed below the Kijun Sen and recent support.
Price continued higher over several hours.
A red histogram bar later appeared below zero on the Rahul Mohindar Oscillator, and the trade was closed as the Rahul Mohindar Oscillator signaled bearish momentum.
Case Study 2: AUDUSD H4 Swing Trade
On AUDUSD H4, the Kijun Sen shifted to sandy brown and price stayed below it during a controlled downtrend.
The Rahul Mohindar Oscillator printed a red histogram bar below zero, confirming bearish pressure.
A sell trade was opened at candle close with the stop loss placed above the Kijun Sen and recent resistance.
Price moved lower across multiple sessions.
A green histogram bar appeared above zero on the Rahul Mohindar Oscillator, and the trade was closed as the Rahul Mohindar Oscillator indicated a shift toward bullish momentum.
Download Now
FAQ
Can I adjust the calculation period of the Kijun Sen line?
Yes, the indicator allows setting a custom period for the Kijun Sen line.
Shorter periods make the line more responsive, while longer periods smooth out signals for longer trends.
Are alerts available for all timeframes?
Alerts work on any timeframe, from 1-minute charts to daily charts.
This feature ensures you don’t miss trend changes, even when trading multiple markets simultaneously.
Is the indicator suitable for scalping?
Yes, traders can use it on smaller timeframes to capture short-term moves.
The alerts help scalpers react quickly to trend shifts while the color changes provide visual confirmation.
How reliable are the buy and sell signals?
The signals are strongest in trending markets.
Combining them with overall market analysis and support/resistance levels improves accuracy and reduces false signals.
Summary
The Kijun Sen with Alerts indicator offers clear trend tracking and timely alerts for traders.
Its color-changing line and adjustable settings help traders adapt to multiple strategies.
The indicator is effective in trending markets and provides both visual and audible notifications to guide entries and exits.
Scalpers and swing traders alike can benefit from its simplicity and responsiveness.
Continuous monitoring with alerts ensures traders can act promptly on emerging trends.


