
About the Donchian Channels Indicator
The Donchian Channels Indicator for MT5 is a volatility-based trend tool created by Richard Donchian, a pioneer of trend-following systems.
It calculates price ranges using recent highs and lows to form a channel that highlights breakout and reversal zones.
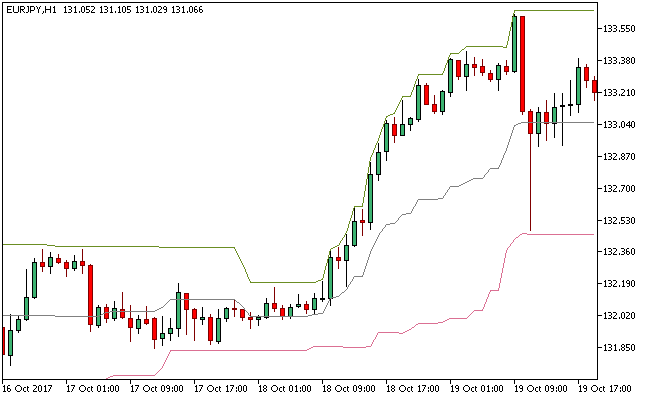
The indicator consists of three lines: an upper band marking the highest high, a lower band marking the lowest low, and a middle line representing the channel center.
The default period is 20, reflecting the average number of trading days in a month, though it can be adjusted for different timeframes.
Traders use Donchian Channels to detect trend continuation, identify breakouts, and manage risk.
It provides clear signals for potential entries and exits, allowing both short-term and long-term traders to make more confident decisions.
Free Download
Key Features
- Upper and lower bands track recent highs and lows over a defined period.
- The middle line provides a central reference for trend bias.
- Detects breakouts and potential reversal points.
- Adaptable period settings for different timeframes.
- Helps manage risk and set logical stop and profit levels.
Indicator Chart
The Donchian Channels Indicator displays a three-line channel directly on the main price chart, highlighting trend direction and potential breakout zones.
Price closing above the middle line along the upper band signals bullish momentum, while closing below the middle line along the lower band indicates bearish pressure.

Guide to Trade with the Donchian Channels Indicator
Buy Rules
- Enter a buy trade when price opens and closes above the middle line.
- Confirm the price is trending toward or along the upper band.
- Check for momentum using candles or supporting indicators.
Sell Rules
- Enter a sell trade when price opens and closes below the middle line.
- Confirm the price is trending toward or along the lower band.
- Check for downward momentum with supporting signals.
Stop Loss
- For buy trades, place the stop loss just below the lower band.
- For sell trades, place the stop above the upper band.
- Keep risk consistent, generally 1–2% of the account per trade.
Take Profit
- Close buy trades if the candle closes back below the middle line.
- Close sell trades if the candle closes back above the middle line.
- Alternatively, target the opposite Donchian band to capture full moves.
Donchian Channels Forex Scalping MT5 Strategy with RSI Hull
This scalping strategy combines trend direction with momentum confirmation to capture short intraday moves.
The Donchian Channels indicator defines the current market direction using price extremes, while the RSI Hull indicator provides precise entry timing through momentum shifts.
In this strategy, an upward channel signals bullish conditions, while a downward channel signals bearish pressure.
The RSI Hull serves as a buy/sell trigger, confirming when momentum crosses key levels.
This setup is designed for fast execution on M5 and M15 timeframes.
It performs best on major pairs such as EURUSD and GBPUSD during high-volume sessions.
Buy Entry Rules
- The Donchian Channel is sloping upward, showing a clear bullish trend.
- Price remains near the upper half of the channel without strong rejection.
- The RSI Hull crosses above the 50 level.
- Enter a buy trade at the close of the confirmation candle.
- Place the stop loss below the middle Donchian line or below the most recent minor pullback.
- Close the trade when the RSI Hull crosses back below the 50 level.
Sell Entry Rules
- The Donchian Channel is sloping downward, confirming bearish direction.
- Price remains near the lower half of the channel without strong rejection.
- The RSI Hull crosses below the 50 level.
- Enter a sell trade at the close of the confirmation candle.
- Place stop loss above the middle Donchian line or above the most recent minor pullback.
- Close the trade when the RSI Hull crosses back above the 50 level.
Case Study 1: EURUSD M5 Scalping Trade
During the London session on EURUSD M5, the Donchian Channel was clearly sloping upward, indicating a bullish environment.
Price stayed in the upper portion of the channel with shallow pullbacks.
The RSI Hull crossed above the 50 level, confirming upward momentum.
A buy trade was opened at candle close with a stop loss placed below the middle Donchian line.
Price continued rising for several candles.
The RSI Hull later crossed below the 50 level, and the trade was closed as the RSI Hull signaled a loss of bullish momentum.
Case Study 2: GBPUSD M15 Scalping Trade
On GBPUSD M15, the Donchian Channel was sloping downward, showing a clear sell trend.
Price remained near the lower boundary of the channel.
The RSI Hull crossed below the 50 level, confirming bearish momentum.
A sell trade was opened at candle close with the stop loss placed above a recent pullback high.
The RSI Hull later crossed above the 50 level, and the trade was closed as the RSI Hull indicated a shift toward bullish pressure.
Download Now
FAQ
How do Donchian Channels help identify trends?
Price positioning relative to the upper, lower, and middle bands reveals trend direction.
Sustained closes above the middle line indicate bullish bias, while closes below suggest bearish bias.
What period is best for different timeframes?
Short-term traders can use the default period of 20, while longer-term charts benefit from higher periods to reduce false signals and better capture trends.
Can Donchian Channels be combined with other tools?
Yes, combining with momentum indicators, moving averages, or support/resistance levels improves accuracy and filters low-probability setups.
Are these signals reliable for intraday trading?
Yes, when adjusted to the timeframe and volatility, Donchian Channels offer strong guidance for short-term entries and exits, especially during trending markets.
Summary
The Donchian Channels Indicator provides a clear method to identify trends, breakouts, and potential reversals using a three-line volatility channel.
Its adaptability across timeframes makes it a versatile tool for traders.
By observing price relative to the middle and outer bands, traders can enter with confidence, manage risk effectively, and plan exits logically.
It performs strongly when combined with trend or momentum filters.
For intraday and swing trading, this indicator simplifies the process of spotting high-probability trades and enhances decision-making in volatile markets.





