
About the Elliott Wave Oscillator
The Elliott Wave Oscillator Indicator for MT5 converts the principles of Elliott Wave theory into a practical technical oscillator that traders can easily follow.
The indicator appears beneath the main price area and displays colored bars that represent market momentum.
These bars move above and below the zero level, allowing traders to quickly identify shifts in trend direction.
When the oscillator rises above zero, it signals strengthening bullish momentum. When it moves below zero, it indicates increasing bearish pressure.
The indicator can be used for scalping, intraday trading, or trend following strategies depending on the timeframe selected.
Several inputs can be customized including the fast moving average period, slow moving average period, calculation method, and applied price.
These parameters allow traders to fine tune the indicator to match their preferred trading style.
Free Download
Key Features
- Transforms Elliott Wave theory into a practical momentum oscillator.
- Displays colored histogram bars to represent bullish and bearish momentum.
- Uses the zero level to identify trend direction changes.
- Green bars appear when the oscillator moves above zero.
- Orange and red bars appear when the oscillator moves below zero.
- Helps traders follow momentum shifts in trending markets.
- Adjustable parameters including fast MA period and slow MA period.
- Compatible with all currency pairs and timeframes.
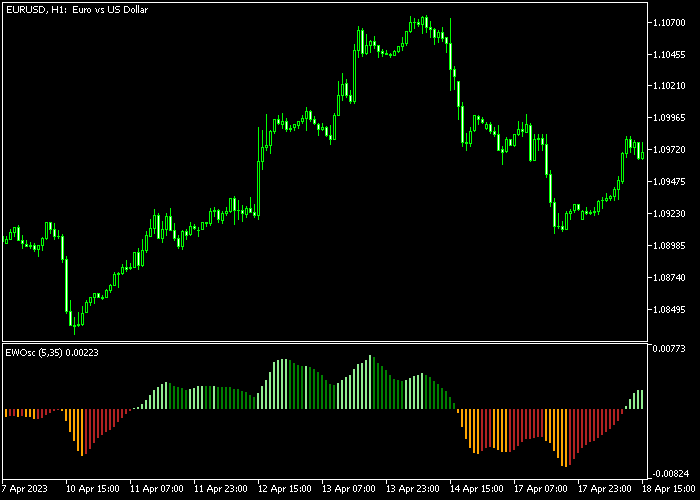
Indicator Chart
The Elliott Wave Oscillator appears beneath the main price area as a momentum histogram that moves above and below the zero level.
Green bars highlight bullish phases while orange and red bars indicate bearish momentum shifts.
Guide to Trade with Elliott Wave Oscillator
Buy Rules
- Wait for the Elliott Wave Oscillator to turn back above the zero level.
- Confirm that green bars begin forming on the oscillator.
- Open a buy position as bullish momentum starts building.
- Ensure price is not approaching strong resistance.
Sell Rules
- Wait for the Elliott Wave Oscillator to turn back below the zero level.
- Confirm that orange or red bars appear on the oscillator.
- Open a sell position as bearish momentum strengthens.
- Avoid selling directly into strong support levels.
Stop Loss
- Place the stop loss 3 pips below technical support for buy trades.
- Place the stop loss 3 pips above technical resistance for sell trades.
Take Profit
- Close all buy trades when the oscillator moves back below the zero level.
- Close all sell trades when the oscillator moves back above the zero level.
- Consider taking partial profits near major support or resistance areas.
Elliott Wave Oscillator and VIDYA Scalping Strategy MT5
This scalping strategy combines the Elliott Wave Oscillator Indicator with the VIDYA Indicator to capture short-term momentum moves inside a clearly defined trend structure.
The Elliott Wave Oscillator measures market momentum and highlights wave phases through a histogram.
A green histogram bar above the zero level signals bullish momentum and a buy opportunity.
Orange or red bars below the zero level signal bearish momentum and sell pressure.
This helps traders identify when momentum is building or fading in real time.
The VIDYA Indicator defines the main trend direction using a volatility adaptive moving average.
A lime green line indicates a bullish trend, while a deep pink line indicates a bearish trend.
This ensures trades are only taken in the direction of the dominant market structure.
This strategy works best on M5 and M15 charts and is suitable for fast intraday trading on pairs such as EURUSD, GBPUSD, USDJPY, GBPJPY, and also gold during London and New York sessions.
Buy Entry Rules
- Wait for the VIDYA line to turn lime green, confirming a bullish trend.
- Wait for the Elliott Wave Oscillator to print a green histogram bar above the zero level.
- Enter a buy trade at the close of the confirmation candle.
- Place stop loss below the most recent swing low or just below the VIDYA line.
- Take profit when the oscillator turns red or orange below zero or when VIDYA turns deep pink.
Sell Entry Rules
- Wait for the VIDYA line to turn deep pink, confirming a bearish trend.
- Wait for the Elliott Wave Oscillator to print a red or orange histogram bar below the zero level.
- Enter a sell trade at the close of the confirmation candle.
- Place stop loss above the most recent swing high or just above the VIDYA line.
- Take profit when the oscillator turns green above zero or when VIDYA turns lime green.
Case Study 1: GBPUSD M5 Buy Scalping Setup
On GBPUSD M5, price started recovering after a short consolidation phase.
The VIDYA line turned lime green and began acting as dynamic support while price formed higher lows.
Shortly after, the Elliott Wave Oscillator printed a green histogram bar above the zero level, confirming bullish momentum.
A buy trade was entered at the close of the signal candle.
The stop loss was placed below the most recent swing low and slightly under the VIDYA line to protect against short pullbacks.
The long trade was closed when the oscillator turned red below zero, signaling weakening bullish momentum.
Case Study 2: USDJPY M15 Sell Scalping Setup
On USDJPY M15, price rejected a resistance zone and the VIDYA line turned deep pink, confirming bearish market structure.
Lower highs began forming under the trend line.
After a small retracement, the Elliott Wave Oscillator printed a red histogram bar below the zero level, confirming renewed selling pressure.
A sell trade was entered at the close of that candle.
The stop loss was placed above the recent swing high and slightly above the VIDYA line to allow normal volatility.
The short trade was closed when the oscillator turned green above zero, signaling a possible reversal or slowdown in bearish momentum.
Download Now
FAQ
What does the zero level represent in the Elliott Wave Oscillator?
The zero level acts as the dividing line between bullish and bearish momentum.
When the oscillator moves above zero it indicates positive momentum, while movement below zero signals negative momentum.
Can the Elliott Wave Oscillator be customized?
Yes. Traders can modify the fast moving average period, slow moving average period, calculation method, and the applied price used in the indicator.
Summary
The Elliott Wave Oscillator Indicator provides a simplified way to follow market momentum using the principles of Elliott Wave analysis.
By transforming wave calculations into a visual oscillator, the indicator helps traders quickly identify bullish and bearish phases.
The zero line serves as the key level that separates positive and negative momentum.
When combined with price action and support or resistance analysis, the signals can help traders improve entry timing and exit decisions.
With adjustable moving average settings and a straightforward visual display, the Elliott Wave Oscillator can be integrated into many trading strategies across different markets and timeframes.


