
About the ADX Super Trend Indicator
The ADX Super Trend indicator for MT4 identifies new buy and sell trends using ADX combined with a moving average.
The default moving average period is set to 250, while a threshold value filters out false signals, defaulting to 0.00001.
A blue line indicates a bullish trend and a potential buy opportunity.
A red line indicates a bearish trend and a potential sell opportunity.
A blank space between the signal lines shows a range-bound or flat market.
Wait for a new color to appear before opening a new trade.
The indicator settings can be adjusted in the inputs tab to suit different trading approaches.
Free Download
Download the “adx-ma.ex4” MT4 indicator
Key Features
- Identifies new bullish and bearish trends using ADX and a moving average.
- Blue line signals a buy trend, red line signals a sell trend.
- The threshold filter reduces false signals in flat markets.
- Blank space indicates a range-bound or uncertain market.
- Adjustable settings for moving average period and threshold.
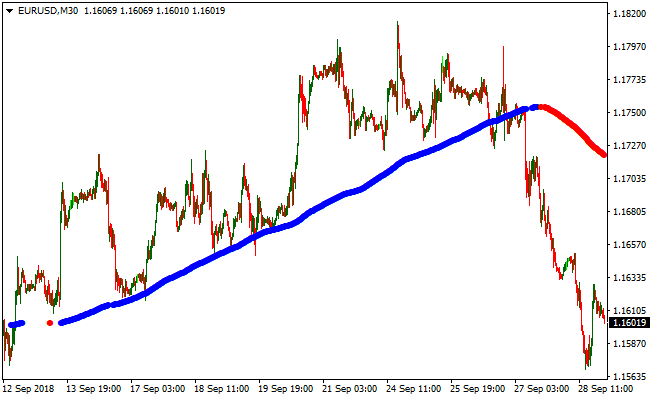
Indicator Chart
The chart displays a single line that changes color to signal trend direction.
Blue indicates a bullish trend, red indicates a bearish trend. Blank sections highlight periods without a clear trend.
Traders can quickly spot trend changes and decide on entry points.
Guide to Trade with ADX Super Trend Indicator
Buy Rules
- Open a buy trade when the signal line changes from red to blue.
- Confirm overall trend using additional trend-following indicators if desired.
- Focus on strong bullish momentum and avoid trades in flat ranges.
- Ignore buy signals if the market is range-bound or volatile without direction.
Sell Rules
- Open a sell trade when the signal line changes from blue to red.
- Confirm overall trend using additional trend-following indicators if desired.
- Focus on strong bearish momentum and avoid trades in flat ranges.
- Ignore sell signals if the market is range-bound or volatile without direction.
Stop Loss
- For buy trades, place the stop below the recent minor swing low or support level.
- For sell trades, place the stop above the recent minor swing high or resistance level.
- Alternatively, use the previous line crossover as a reference point for your stop.
Take Profit
- Close buy trades when the signal line turns red.
- Close sell trades when the signal line turns blue.
- Optionally, set a fixed profit target based on your risk-reward plan.
ADX Super Trend + Ultimate Pro Scalper Forex Strategy for MT4
This MT4 scalping strategy combines the ADX Super Trend Indicator with the Ultimate Pro Scalper Indicator.
The ADX Super Trend line shows the market trend: blue line for an uptrend and red line for a downtrend.
The Ultimate Pro Scalper provides entry signals with dots: green for buy and red for sell.
By using both indicators together, traders can quickly spot trend direction and take fast scalping trades on M1 and M5 charts.
This strategy is best suited for scalpers targeting short-term moves on major currency pairs during active trading sessions.
Buy Entry Rules
- Confirm the ADX Super Trend line is blue, indicating an uptrend.
- Wait for a green dot from the Ultimate Pro Scalper while the trend remains up.
- Enter a buy trade immediately after the green dot appears.
- Place a stop loss a few pips below the low of the signal candle or recent swing low.
- Take profit after a small move between 5 and 15 pips or when the trend line turns red or a red dot appears.
Sell Entry Rules
- Confirm the ADX Super Trend line is red, indicating a downtrend.
- Wait for a red dot from the Ultimate Pro Scalper while the trend remains down.
- Enter a sell trade immediately after the red dot appears.
- Place a stop loss a few pips above the high of the signal candle or recent swing high.
- Take profit after a small move between 5 and 15 pips or when the trend line turns blue or a green dot appears.
Advantages
- Combines trend direction with precise scalping signals to reduce counter-trend trades.
- Clear trading signals make it easy to read and execute trades quickly.
- Effective for fast entries and exits on M1 and M5 charts during high liquidity periods.
- Small stop losses keep risk limited for each trade.
- Easy to follow, even for beginner scalpers.
Drawbacks
- Signals may appear too frequently, which can tempt traders to enter low-quality trades.
- Small pip targets mean that transaction costs and spreads can reduce overall profitability.
- Scalping on M1 and M5 charts can be stressful and requires constant attention.
- Not suitable for low liquidity pairs or sessions with wide spreads, as small price movements may not be enough for profit.
Example Case Study 1 – EURUSD M1
During the London session on EURUSD M1, the ADX Super Trend line turned blue.
A green Ultimate Pro Scalper dot appeared at 1.1345.
A buy trade was entered with a stop loss at 1.1340, five pips below entry.
Within seven minutes, price rose to 1.1358, a gain of 13 pips.
The trade was closed at that level when either a red dot appeared on the chart.
Example Case Study 2 – USDJPY M5
On USDJPY M5 during the Asian session, the trend line was red.
A red dot appeared at 149.23.
A sell trade was opened with a stop loss at 149.33, ten pips above entry.
Over the next 12 minutes, the pair declined to 149.08, gaining 15 pips.
The trade was closed when a green dot appeared on the chart.
Strategy Tips
- Check the higher timeframe trend (M15 or H1) to avoid trading against a stronger market direction.
- Use tight spreads and low-latency brokers for scalping to minimize slippage and execution delays.
- Consider using a trailing stop to lock in small profits when price moves favorably.
- Avoid taking trades when the trend line is flat or about to change color to reduce uncertain setups.
- Monitor session times; London and New York sessions often provide the most reliable short-term moves.
- Do not increase lot size after a losing trade; stick to a consistent risk per trade.
Download Now
Download the “adx-ma.ex4” Metatrader 4 indicator
FAQ
What is the purpose of the threshold value?
The threshold filters small price movements to reduce false trend signals. Adjust it to suit the market volatility.
How do I know when the market is range-bound?
A blank space between the lines indicates the market is flat or indecisive. Avoid entering trades during these periods.
Is it suitable for scalping or longer-term trading?
It can be used for both short-term and longer-term trades. Adjust the timeframe and moving average period to match your strategy.
Summary
The ADX Super Trend indicator for MT4 provides Forex traders with a simple way to identify new buy and sell trends.
Blue and red lines make trend direction easy to see at a glance.
This tool is ideal for spotting trend reversals and following the market momentum.
Combining it with trend confirmation helps focus on higher-probability trades, manage entries, and exit efficiently.


