
About the Harmonic Pattern Scanner V3 Indicator
The Harmonic Pattern Scanner V3 for MT5 automatically identifies harmonic chart patterns on any Forex chart.
It scans price action in real-time and displays bullish and bearish patterns directly on the price chart, helping traders spot potential trade opportunities without delay.
The indicator recognizes multiple patterns, including AB=CD, Gartley, Bat, Crab, Butterfly, Three Drives, Cypher, Shark, Nen Star, Black Swan, White Swan, Leonardo, and several Anti-pattern variations.
Each pattern is based on pure price action, which ensures signals do not lag behind market movement.
Traders can adjust numerous settings, including Zig Zag parameters, color schemes, pattern selection, and display styles.
This allows the indicator to be tailored to different trading styles and chart preferences.
Free Download
harmonic-pattern-finder-v3-indicator.mq5 Indicator (MT5)
Key Features
- Automatically detects multiple harmonic chart patterns.
- Displays bullish and bearish setups directly on the price chart.
- Works based purely on price action with no lag.
- Supports AB=CD, Gartley, Bat, Crab, Butterfly, Three Drives, Cypher, Shark, and other patterns.
- Customizable Zig Zag settings, pattern selection, colors, and styles.
- Helps traders identify high-probability entry points.
- Provides clear stop loss and take profit references from patterns.
Indicator Chart
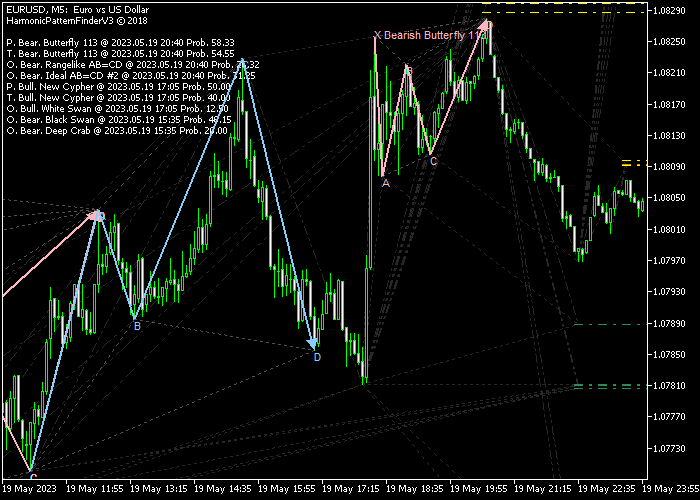
The Harmonic Pattern Scanner V3 plots detected harmonic patterns directly on the price chart, using visual markers to show bullish and bearish setups.
Each pattern highlights entry zones, stop loss placement, and potential targets.
Traders can immediately see which areas of the chart offer high-probability trades and can act accordingly without manually analyzing complex pattern rules.

Guide to Trade with Harmonic Pattern Scanner V3 Indicator
Buy Rules
- Wait for a bullish harmonic pattern to appear on the chart.
- This indicates a potential upward move.
- Open a buy trade after the pattern confirms the setup.
- Use the pattern structure to identify the optimal entry area.
Sell Rules
- Wait for a bearish harmonic pattern to appear on the chart.
- This signals a potential downward move.
- Open a sell trade after the pattern confirms the setup.
- Use the pattern structure to determine the best entry zone.
Stop Loss
- Place the stop loss slightly beyond the pattern’s high or low point.
- For buy trades, position the stop below the pattern’s lowest point.
- For sell trades, position the stop above the pattern’s highest point.
- This placement limits risk while respecting the pattern’s structure.
Take Profit
- Close the trade at the pattern’s target levels suggested by its structure.
- Alternatively, use a fixed take profit based on your preferred strategy.
- Partial exits can be taken at intermediate levels within the pattern.
- Consider exiting early if price fails to follow the pattern’s momentum.
Harmonic Pattern Scanner V3 and Triple Jurik Forex Strategy for MT5
This strategy combines the Harmonic Pattern Scanner V3 Indicator with the Triple Jurik Smooth Moving Average Indicator to create a clean trend-confirmation and pattern-based trading approach.
The Harmonic Pattern Scanner identifies potential reversal structures directly on the chart.
A bullish harmonic pattern signals a possible buy setup, while a bearish harmonic pattern signals a possible sell setup.
These patterns highlight areas where price is likely to react due to Fibonacci-based structure.
The Triple Jurik Smooth Moving Average helps confirm trend direction using three smoothed lines.
When all three lines are green, the market is in a bullish trend. When all three lines turn violet, the market is in a bearish trend.
This helps filter out low-quality harmonic signals.
This strategy works best on M15 and H1 charts, where harmonic patterns form more reliably and trends are smoother.
Buy Entry Rules
- Wait for a bullish harmonic pattern to appear on the chart.
- Confirm that all three Jurik smooth lines are green, indicating an uptrend.
- Enter a buy trade after the pattern completes and price shows a small bullish reaction.
- Place a stop loss below the harmonic pattern completion zone.
- Close the trade when a bearish harmonic pattern appears or when the moving averages turn violet.
Sell Entry Rules
- Wait for a bearish harmonic pattern to appear on the chart.
- Confirm that all three Jurik smooth lines are violet, indicating a downtrend.
- Enter a sell trade after the pattern completes and price starts rejecting downward.
- Place the stop loss above the harmonic pattern completion zone.
- Close the trade when a bullish harmonic pattern appears or when the moving averages turn green.
Case Study 1: Bullish Harmonic Setup
On EURUSD M15, a bullish Gartley pattern appeared near a previous support area.
Shortly after, the Triple Jurik Smooth Moving Average showed all green lines, confirming upward trend conditions.
A buy trade was entered after the pattern completed and the EURUSD moved upward in a controlled way.
The trade was closed for 37 pips when a bearish harmonic pattern formed later on the chart.
Case Study 2: Bearish Harmonic Setup
On GBPJPY H1, a bearish Crab pattern formed near a resistance zone.
The Triple Jurik Smooth Moving Average showed all violet lines, confirming bearish trend conditions.
A sell trade was entered after pattern completion and initial rejection.
Price moved downward following the harmonic structure.
The trade was closed for a small loss when a bullish harmonic pattern appeared later in the session.
Download Now
harmonic-pattern-finder-v3-indicator.mq5 Indicator (MT5)
FAQ
Which patterns does the Harmonic Pattern Scanner V3 detect?
It detects AB=CD, Gartley, Bat, Crab, Butterfly, Three Drives, Cypher, Shark, Nen Star, Black Swan, White Swan, Leonardo, and multiple Anti-patterns.
Can the indicator be customized?
Yes. Traders can adjust Zig Zag settings, select which patterns to scan for, modify colors, and choose display styles.
How are buy and sell signals generated?
Signals appear when a bullish or bearish harmonic pattern is identified on the chart. Each pattern suggests potential entry, stop loss, and target levels.
Does this indicator lag price movement?
No. It is based purely on price action, so it displays patterns in real-time as the market forms them.
Summary
The Harmonic Pattern Scanner V3 makes spotting complex harmonic setups straightforward.
It automatically identifies bullish and bearish patterns and shows clear entry zones, stops, and potential targets.
By highlighting high-probability areas on the chart, it allows traders to act quickly on emerging price patterns.
The flexibility of settings and pattern options makes it a practical tool for both intraday and swing trading approaches.
Traders can combine its signals with additional confirmation methods or use them as standalone guidance to identify structured price moves in the market.





