
About the Coppock Oscillator Indicator
The Coppock Oscillator indicator for MT5 is a classic technical tool used to identify potential buy and sell opportunities in trending markets.
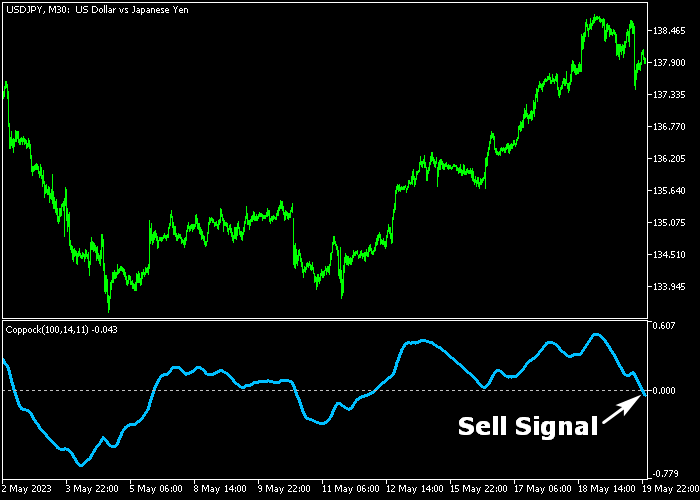
It plots a single blue line that oscillates above and below the zero level in a separate window below the main chart.
When the blue line crosses above zero, it signals the start of a bullish trend.
Conversely, when the line crosses below zero, it indicates a potential bearish trend.
Traders often combine it with other trend indicators for confirmation and more precise entry points.
The indicator’s settings can be adjusted, including the main period, two Rate of Change (ROC) periods, and the applied price.
This flexibility allows traders to tune the indicator to suit different currency pairs and timeframes.
Free Download
Key Features
- Plots a blue line oscillating around the zero level to indicate trend shifts.
- Signals bullish trends when crossing above zero and bearish trends when crossing below zero.
- Works in combination with other trend-following indicators.
- Adjustable periods and ROC values for customized responsiveness.
- Easy-to-read visual signals in a separate chart window.
Indicator Chart
The Coppock Oscillator appears in a separate window below the main price chart.
Its blue line oscillates above and below zero to reflect bullish and bearish market conditions.
Crosses above zero suggest upward momentum, while crosses below zero indicate downward pressure.
Traders monitor these signals to determine potential entry points aligned with the market trend.
Guide to Trade with the Coppock Oscillator Indicator
Buy Rules
- Wait for the blue Coppock line to cross above the zero level.
- This signals the beginning of bullish momentum.
- Open a buy trade after the crossover is confirmed.
- Ensure the trend is supported by additional indicators or price action for better timing.
Sell Rules
- Wait for the blue Coppock line to cross below the zero level.
- This signals the start of bearish momentum.
- Open a sell trade once the crossover is confirmed.
- Check trend alignment with other tools before entering to reduce false signals.
Stop Loss
- Place the stop loss slightly beyond the nearest support for buy trades.
- For sell trades, position the stop just above the nearest resistance.
- Alternatively, use recent swing highs or lows for more dynamic stop placement.
Take Profit
- Close the trade when the Coppock line reverses and crosses the zero level in the opposite direction.
- Traders may also set a fixed take profit target based on their strategy.
- Consider exiting early if momentum stalls before reaching your intended target.
Directional Breakout and Super Trend Hull Scalping Strategy for MT5
This strategy combines the Directional Breakout Indicator with the Super Trend Hull Indicator to build a fast scalping approach focused on short momentum bursts and trend alignment.
The Directional Breakout Indicator shows immediate market pressure through a histogram.
Green bars signal bullish momentum and potential buy setups, while red bars signal bearish momentum and potential sell setups.
The Super Trend Hull Indicator defines the broader intraday trend using a colored line, where green confirms an uptrend and violet confirms a downtrend.
This strategy is designed for M1 and M5 charts where price moves quickly and traders need fast confirmation before entering trades.
It works best during London and New York sessions when liquidity is high.
Buy Entry Rules
- Wait for green histogram bars on the Directional Breakout Indicator, showing active bullish momentum.
- Confirm that the Super Trend Hull line is green, confirming an upward trend bias.
- Enter a buy trade at the close of the confirmation candle or the next candle open.
- Place stop loss below the most recent swing low or just under the Super Trend Hull line.
- Close the trade when the histogram turns red or when the Super Trend Hull line switches to violet.
Sell Entry Rules
- Wait for red histogram bars on the Directional Breakout Indicator, showing bearish momentum.
- Confirm that the Super Trend Hull line is violet, confirming a downward trend bias.
- Enter a sell trade at the close of the confirmation candle or the next candle open.
- Place stop loss above the most recent swing high or just above the Super Trend Hull line.
- Close the trade when the histogram turns green or when the Super Trend Hull line switches to green.
Case Study 1: M1 Momentum Scalping Buy Setup
On EURUSD M1 during the London session, price was initially moving sideways with small candles and no clear direction.
Suddenly, the Directional Breakout Indicator printed a strong sequence of green histogram bars, showing increasing bullish pressure.
At the same time, the Super Trend Hull line remained green and began to slope upward more sharply, confirming that the market was transitioning into an uptrend.
After a small pullback candle, another green histogram bar appeared, confirming continuation of momentum.
A buy trade was entered at the close of that candle.
The stop loss was placed just below the most recent micro swing low to protect against sudden pullbacks common on M1 charts.
Price moved upward in short impulsive waves with minor retracements.
Each pullback respected the Super Trend Hull line, which acted as dynamic support.
After several candles, the Directional Breakout Indicator shifted and printed its first red bar, signaling weakening bullish momentum.
The trade was closed at that point to secure the move before a possible reversal began.
Case Study 2: M5 Trend Scalping Sell Setup
On GBPUSD M5 during the New York session, price attempted to break higher but failed and started forming lower highs.
The Super Trend Hull line had already turned violet, showing that the broader intraday bias had shifted bearish.
Shortly after, the Directional Breakout Indicator printed consecutive red histogram bars, confirming increasing selling pressure and continuation of the downward move.
A sell trade was entered at the close of the confirmation candle.
The stop loss was placed above the most recent swing high and slightly above the Super Trend Hull line to allow room for volatility.
Price moved downward in a structured way, with brief retracements that failed to break the Super Trend Hull resistance line.
After several candles, the histogram began to weaken and turned green, indicating fading bearish momentum.
The trade was closed at that point to avoid a potential reversal phase.
Download Now
FAQ
Can this indicator be used with other trend tools?
Yes. Combining the Coppock Oscillator with moving averages or trend indicators can improve signal reliability and timing.
Are the indicator settings adjustable?
Yes. Traders can modify the main period, ROC periods, and applied price to fit different trading pairs and timeframes.
Which timeframes are suitable for the Coppock Oscillator?
The indicator works on all timeframes. Shorter timeframes give more frequent signals, while higher timeframes are better for spotting longer-term trends.
Summary
The Coppock Oscillator indicator offers a simple way to track trend reversals using zero-level crossovers.
Upward crosses suggest bullish opportunities, while downward crosses indicate potential short positions.
With adjustable settings and optional confirmation from other trend tools, the indicator helps traders pinpoint entry points and evaluate ongoing momentum.
Its clear visual signal makes it easy to incorporate into both short-term and longer-term trading strategies.





