About the Vortex Trend Indicator
The Vortex Trend Indicator for MT5 is a technical tool based on the original Vortex Indicator but enhanced to provide clear trend signals.
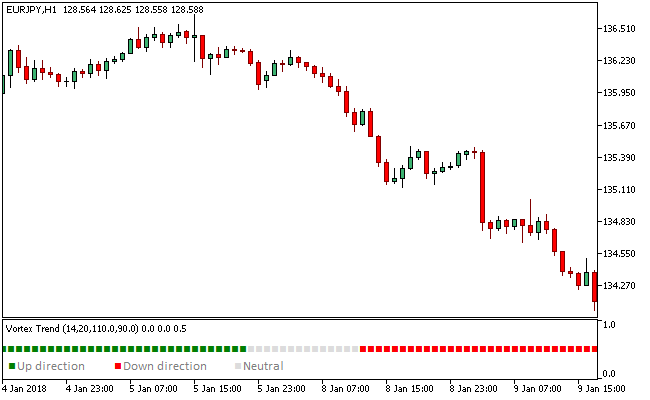
It displays a colored diagram in a separate window that helps traders identify bullish, bearish, and sideways market conditions.
Green signals indicate a bullish trend, red signals indicate a bearish trend, and gainsboro signals mark a sideways or consolidating market.
The indicator includes a “Use vortex smoothing” option, which reduces random signals when enabled, making trend detection more reliable.
This indicator can be used as a standalone tool for trend identification or alongside other trading strategies to confirm entries and exits.
It works on all currency pairs and multiple timeframes, making it suitable for scalping, intraday, and swing trading.
Free Download
Key Features
- Displays colored trend signals in a separate window: green for bullish, red for bearish, gainsboro for sideways.
- “Use vortex smoothing” option reduces random signals for more reliable trend detection.
- Helps traders identify trend direction and market consolidation.
- Can be used alone or as a confirmation tool with other indicators.
- Lightweight and efficient on MT5 platforms.
Indicator Chart
The Vortex Trend Indicator shows a colored diagram below the main chart.
Green segments signal bullish trends, red segments signal bearish trends, and gainsboro segments highlight sideways price action.
The chart allows traders to quickly assess market direction and potential trade opportunities.

Guide to Trade with Vortex Trend Indicator
Buy Rules
- Wait for the trend color to turn green.
- Confirm that price action supports a bullish trend.
- Check other trend-confirming indicators if desired.
- Open a buy trade when the green signal aligns with momentum.
Sell Rules
- Wait for the trend color to turn red.
- Confirm that price action supports a bearish trend.
- Check other trend-confirming indicators if desired.
- Open a sell trade when the red signal aligns with momentum.
Stop Loss
- Place stop losses below recent swing lows for buy trades.
- Place stop losses above recent swing highs for sell trades.
- Consider using a buffer of a few pips beyond the swing for protection.
Take Profit
- Close buy trades if the trend color turns red.
- Close sell trades if the trend color turns green.
- Optionally take profit at previous swing highs or lows.
- Consider trailing profits to maximize gains during strong trends.
MT5 Scalping Strategy Using Vortex Trend Indicator
This scalping strategy combines the Vortex Trend Indicator with the Aroon Oscillator MTF Indicator to capture short bursts of momentum during active trading sessions.
The Vortex Trend Indicator measures directional pressure through colored histogram bars.
Green bars indicate bullish momentum while red bars reflect bearish control.
The Aroon Oscillator MTF confirms timing through zone-based signals.
A blue zone reflects bullish conditions while a brown zone indicates bearish momentum.
It helps filter entries by confirming whether price is actively trending or transitioning into reversal phases.
This strategy is designed for M5 and M15 charts during the London and New York sessions where volatility and liquidity are highest.
Buy Entry Rules
- Confirm that the Vortex Trend Indicator shows green histogram bars, indicating bullish momentum.
- Wait for the Aroon Oscillator MTF to display a blue zone confirming buy pressure.
- Enter a buy trade at the close of the signal candle during active session conditions.
- Place the stop loss below the most recent intraday swing low or below a short consolidation zone.
- Close the trade when the Vortex Trend Indicator switches to red histogram bars because it signals bearish momentum taking over.
- Alternative exit: close the trade when the Aroon Oscillator MTF turns into a brown zone because it confirms a bearish shift in direction.
Sell Entry Rules
- Confirm that the Vortex Trend Indicator shows red histogram bars, indicating bearish momentum.
- Wait for the Aroon Oscillator MTF to display a brown zone confirming sell pressure.
- Enter a sell trade at the close of the signal candle during active trading hours.
- Place the stop loss above the most recent intraday swing high or above a rejection zone.
- Close the trade when the Vortex Trend Indicator switches to green histogram bars because it signals bullish momentum returning.
- Alternative exit: close the trade when the Aroon Oscillator MTF turns into a blue zone because it confirms a bullish reversal in progress.
Case Study 1
On GBPUSD M5 during the London session, the Vortex Trend Indicator printed strong green histogram bars showing upward momentum.
Two candles later, the Aroon Oscillator MTF turned blue confirming bullish pressure.
A buy trade was opened at candle close. The stop loss was placed below a recent intraday swing low formed during a brief consolidation.
Later in the session, the Vortex Trend Indicator turned red and the buy trade was closed because the indicator signaled that bearish momentum had taken over.
Case Study 2
On EURJPY M15 during the New York session, the Vortex Trend Indicator showed red histogram bars indicating strong bearish movement.
The Aroon Oscillator MTF confirmed a brown zone at the same time.
A sell trade was opened at the signal candle close.
The stop loss was placed above a recent rejection high formed before continuation.
Four hours later, the Aroon Oscillator MTF switched to a blue zone and the short trade was closed because the indicator signaled a bullish reversal in direction.
Download Now
FAQ
What do the different colors in the Vortex Trend Indicator mean?
Green indicates a bullish trend, red indicates a bearish trend, and red represents a sideways or consolidating market.
What is the “Use vortex smoothing” option?
Enabling vortex smoothing reduces random signals and makes trend detection more reliable.
Disabling it may produce more frequent but less consistent signals.
Summary
The Vortex Trend Indicator is a reliable tool for identifying bullish, bearish, and sideways market conditions using colored signals.
The visual diagram simplifies trend analysis and helps traders make informed entry and exit decisions.
Enabling the smoothing option increases signal accuracy, while combining it with other indicators or trend analysis improves trade timing and risk management.


