
About the Nema Indicator
The Nema Indicator for MT5 is designed to identify short-term trading opportunities suitable for scalpers and day traders.
It provides timely buy and sell signals using a simple two-color line plotted directly on the price chart.
The indicator’s blue line signals a buy trend, while the orange line signals a sell trend.
This visual system allows traders to act quickly in fast-moving markets.
Nema is best applied on low-spread currency pairs to minimize trading costs.
It performs optimally during the London and American trading sessions when volatility is higher and price movements are stronger.
Customizable inputs include Nema period, Nema depth, and price type.
These settings allow traders to fine-tune the indicator to different instruments and timeframes.
Free Download
Key Features
- Two-color line for fast buy and sell signals.
- Optimized for short-term scalping and day trading.
- The blue line indicates a bullish trend.
- The orange line indicates a bearish trend.
- Adjustable Nema period and depth for sensitivity control.
- Works best on low-spread currency pairs.
- Designed for London and American trading sessions.
- Easy to interpret and trade directly from the price chart.
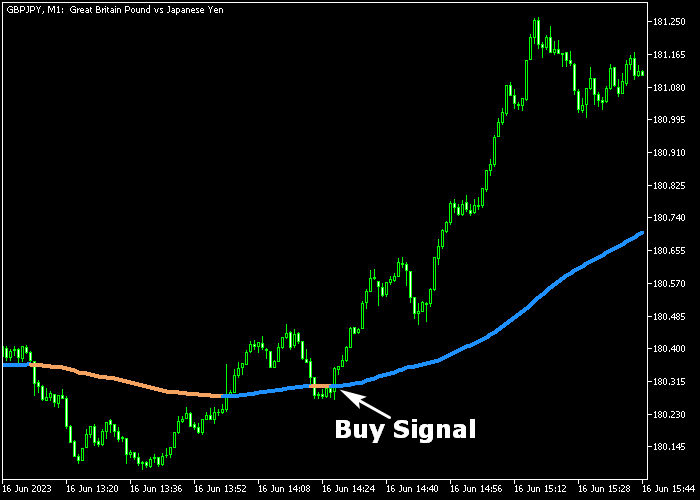
Indicator Chart
The Nema Indicator shows a two-color line overlaid on price.
Blue lines indicate potential buy opportunities, while orange lines indicate potential sell opportunities.
When the blue line appears after an orange segment, bullish momentum may be building.
When the orange line appears after blue, bearish pressure is increasing.
Guide to Trade with Nema Indicator
Buy Rules
- Wait for the blue Nema line to appear on the chart.
- Enter a buy position as the blue line forms.
- Follow the trend while the blue line remains active.
Sell Rules
- Wait for the orange Nema line to appear on the chart.
- Enter a sell position as the orange line forms.
- Follow the trend while the orange line remains active.
Stop Loss
- For buy trades, place the stop just below the recent short-term support.
- For sell trades, place the stop just above the recent short-term resistance.
- Do not move the stop too far from the support or resistance level to maintain accuracy.
Take Profit
- Close buy trades when the line changes from blue to orange.
- Close sell trades when the line changes from orange to blue.
- Alternatively, take profits at a predetermined fixed target.
- Consider holding positions if momentum continues in the trade direction.
NEMA MT5 Intraday Strategy with MACD and Awesome Oscillator Indicator
This intraday strategy combines the NEMA Indicator with the MACD with Awesome Oscillator Indicator to capture strong directional moves during active market sessions.
The NEMA Indicator shows trend direction using a colored moving average line.
This trend filter helps traders stay with the direction that has the best chance of producing meaningful moves.
The MACD with Awesome Oscillator indicator provides early entry signals based on momentum.
The first green bar above zero indicates fresh bullish momentum, while the first red bar below zero suggests fresh bearish momentum.
These initial bars often align with strong intraday moves when the trend is established.
This setup works best on M5 and M15 charts during the London and New York sessions when volatility and volume are higher.
Buy Entry Rules
- Confirm that the NEMA line is blue, showing a bullish trend.
- Wait for the first green bar above zero from the MACD with Awesome Oscillator.
- Enter a buy trade at the opening of the next candle.
- Place a protective stop loss just below recent swing support.
- Take profit when the NEMA line turns orange or when the oscillator shows the first red bar below zero.
Sell Entry Rules
- Confirm that the NEMA line is orange, showing a bearish trend.
- Wait for the first red bar below zero from the MACD with Awesome Oscillator.
- Enter a sell trade at the opening of the next candle.
- Place a stop loss just above recent swing resistance.
- Take profit when the NEMA line turns blue or when the oscillator shows the first green bar above zero.
Case Study 1: AUDUSD M5 Buy Signal
On AUDUSD M5 during the London session, the NEMA line was blue as price pulled back slightly within a larger up move.
After this brief pullback, the MACD with Awesome Oscillator printed the first green bar above zero, signaling that bullish momentum was returning.
A buy trade was opened at the next candle. The stop loss was placed just below the recent swing low.
Price climbed steadily with strong bullish candles following.
The position remained open while the NEMA line stayed blue.
Later, the trade was closed for 27 pips when the oscillator printed its first red bar below zero, indicating that upward momentum was fading and price could begin to reverse.
Case Study 2: USDCHF M15 Sell Drive
On USDCHF M15 during the New York session, the NEMA line turned orange after price failed to hold higher levels and started to drift lower.
Shortly after this shift, the MACD with Awesome Oscillator showed the first red bar below zero, signaling emerging bearish momentum.
A sell trade was entered at the next candle’s open.
The stop loss was placed above the swing high formed just before the signal.
Price moved down in a controlled manner with increasing bearish pressure.
The short trade was exited when the NEMA line turned blue, signaling a potential trend shift toward the upside and suggesting that the bearish move was losing strength.
Download Now
FAQ
What type of trading is Nema best for?
Nema is ideal for short-term scalping and day trading. Its quick signals allow traders to act in fast-moving markets.
Which currency pairs are most suitable?
Low-spread pairs are recommended to reduce trading costs, especially during London and American sessions when volatility is higher.
Can the indicator be customized?
Yes. Traders can adjust Nema period, depth, and price type to suit different instruments and trading styles.
Does the line repaint?
The line updates with each new price movement. Signals are based on the current trend and reflect live market conditions.
Summary
The Nema Indicator delivers short-term buy and sell signals using a simple two-color line. It is lightweight, easy to read, and optimized for fast trading.
Its adjustable settings allow traders to fine-tune signals for different currency pairs and timeframes.
The indicator is particularly effective during high-volatility trading sessions.


