
About the DSS Bressert Indicator
The DSS Bressert Indicator for MT5 is a momentum oscillator built on the Double Smoothed Stochastic concept.
It refines traditional stochastic calculations by applying additional smoothing, resulting in more stable and responsive signals.
The indicator behaves similarly to the classic Stochastic oscillator but reduces market noise through double smoothing.
This makes turning points easier to identify, especially when trading in the direction of the dominant trend.
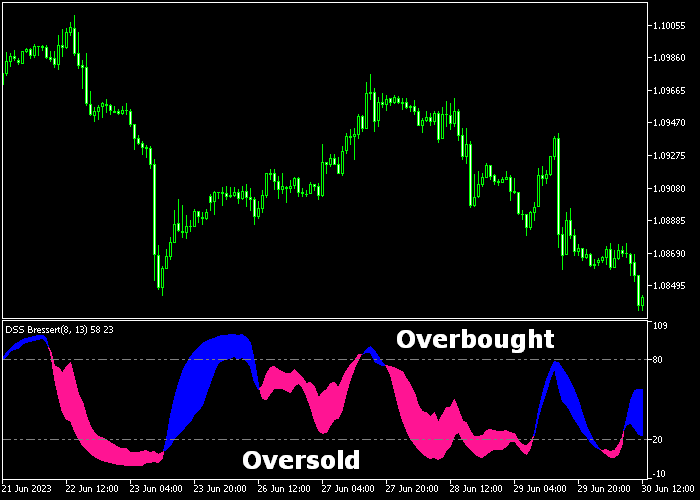
Readings above 80 indicate an overbought condition. Readings below 20 signal an oversold market state.
These zones help traders time pullbacks within trending markets.
Key inputs such as EMA period, Stochastic period, and horizontal shift can be adjusted to control sensitivity and signal timing.
Free Download
dssbressert.mq5 Indicator (MT5)
Key Features
- Based on Double Smoothed Stochastic calculations.
- Highlights overbought levels above 80.
- Identifies oversold levels below 20.
- Smoother signals compared to standard Stochastic.
- Customizable EMA and Stochastic periods.
- Works effectively when aligned with the overall trend.
Indicator Chart
The DSS Bressert Indicator appears in a separate window below the main price area as a smooth oscillating line.
When the line moves above 80, the market enters an overbought phase.
When it drops below 20, the market reaches oversold territory.
Reversals from these zones often provide continuation entries within trending conditions.
Guide to Trade with DSS Bressert Indicator
Buy Rules
- Confirm that the overall market is in a clear uptrend.
- Wait for the DSS Bressert line to drop below 20 and turn back upward.
- Enter a buy trade as the indicator crosses back above 20.
- Trade only in the direction of the prevailing bullish trend.
Sell Rules
- Confirm that the overall market is in a clear downtrend.
- Wait for the DSS Bressert line to rise above 80 and turn downward.
- Open a sell trade as the indicator crosses back below 80.
- Trade only in the direction of the prevailing bearish trend.
Stop Loss
- For buy trades, place the stop loss below a recent higher low.
- For sell trades, place the stop loss above a recent lower high.
- Alternatively, use a volatility-based stop aligned with recent price swings.
Take Profit
- Close the buy trade when the DSS Bressert reaches the 80 level.
- Close the sell trade when the DSS Bressert reaches the 20 level.
- Exit early if the overall trend shows signs of reversal.
DSS Bressert Indicator and Karpenko MT5 Trend Activity Strategy
This strategy blends momentum reversal signals with dynamic trend confirmation to identify high‑probability trades.
It uses the DSS Bressert Indicator to spot strength shifts within an existing trend and the Karpenko Indicator to confirm the prevailing trend environment.
The result is a professional, structured method for capturing moves with both trend direction and momentum alignment.
The DSS Bressert oscillator excels at finding reversal points while filtering noise common in standard oscillators.
In an uptrend condition confirmed by the Karpenko cloud turning pale green, a DSS Bressert line dropping below 20 and then turning upward signals a strong buy opportunity.
Similarly, when the cloud shifts to light pink and the DSS Bressert line rises above 80 before turning down, it suggests a high‑probability sell setup.
This strategy performs best on M15 and H1 charts during the London and New York sessions.
Buy Entry Rules
- Confirm that the Karpenko cloud has turned pale green, indicating a bullish trend environment.
- Watch for the DSS Bressert line to fall below the 20 level and then curve back upward, showing building bullish momentum.
- Enter a buy trade at the first candle close after the DSS Bressert reversal is confirmed within the green cloud trend.
- Place the stop loss below the most recent swing low or below a nearby support level in the same trend direction.
- Take profit near the next significant resistance, or exit if the DSS Bressert line begins to turn downward before reaching the target.
Sell Entry Rules
- Confirm that the Karpenko cloud has turned light pink, indicating a bearish environment.
- Wait for the DSS Bressert line to rise above 80 and then turn downward, signaling increasing bearish momentum.
- Enter a sell trade on the next candle close after this reversal is confirmed within the pink cloud trend.
- Place the stop loss above the recent swing high or just above the nearest resistance level in the trend.
- Take profit near the next significant support, or exit early if the DSS Bressert line begins to turn upward ahead of your target.
Case Study 1: EUR/USD M15 Bullish Continuation
On the M15 chart during the London session, EUR/USD developed a bullish trend as the Karpenko cloud transitioned from neutral into pale green.
After a minor retracement, the DSS Bressert line dropped below the 20 level and then began turning upward.
This shift in the oscillator within the bullish cloud suggested renewed upside momentum.
A buy trade was initiated at the close of the next candle, with the stop loss placed just beneath the recent swing low.
Price continued higher with strong momentum, and the trade reached a key resistance area where profits were taken.
Case Study 2: GBP/JPY H1 Trend Reversal Sell
During the New York session on the H1 timeframe, GBP/JPY showed a shift into a bearish condition as the Karpenko cloud turned light pink.
After a brief upward retracement, the DSS Bressert line climbed above the 80 level and subsequently curved downward, signaling bearish continuation.
A sell position was taken at the next candle close, with the stop loss set just above the swing high established during the retracement.
Price moved lower with sustained momentum as sellers remained in control.
The short trade was closed for +87 pips near a nearby support area to lock in profits before a counter move developed.
Download Now
dssbressert.mq5 Indicator (MT5)
FAQ
What makes DSS Bressert different from a standard Stochastic?
DSS Bressert applies double smoothing to the stochastic calculation.
This reduces false signals and produces cleaner turning points.
Should it be traded in ranging markets?
It performs best when traded in agreement with the dominant trend. In choppy sideways markets, signals may lose reliability.
Can I adjust the sensitivity of the indicator?
Yes. Modifying the EMA period and Stochastic period changes how quickly the oscillator reacts to price movement.
Is the 80/20 level fixed?
The standard levels are 80 for overbought and 20 for oversold. Advanced traders may experiment with slight adjustments depending on volatility.
Summary
The DSS Bressert Indicator for MT5 offers a refined approach to momentum analysis by applying double smoothing to stochastic calculations.
Its reaction around the 80 and 20 levels helps traders identify high-probability pullbacks within established trends.
The smoother movement reduces noise and makes turning points easier to interpret.
With adjustable EMA and stochastic settings, traders can fine-tune responsiveness to match their preferred timeframe and trading style.


