
About the Donchian Fibonacci Fibo Clouds Indicator
The Donchian Fibonacci Fibo Clouds Indicator for MT5 is a trend-following tool that blends Donchian channel logic with Fibonacci-based cloud zones.
It helps traders identify the prevailing market direction and define structured entry and exit areas.
The indicator plots colored cloud channels directly on the main price chart.
These clouds expand and contract based on recent price extremes, forming dynamic support and resistance zones.
An upward sloping Donchian Fibo channel signals a bullish trend. A downward sloping channel signals bearish conditions.
The middle red line acts as a key reaction level, while the outer cloud boundaries define potential profit targets.
Traders can customize the averaging period, extreme points type, margins, Fibonacci levels, and colors to match their preferred trading style.
Free Download
donchian_fibo_clouds.mq5 Indicator (MT5)
Key Features
- Combines Donchian channels with Fibonacci cloud levels.
- Displays dynamic trend direction on the main price chart.
- Middle reaction line for precise entry timing.
- Upper and lower cloud bands for target projection.
- Customizable averaging period and extreme point settings.
Indicator Chart
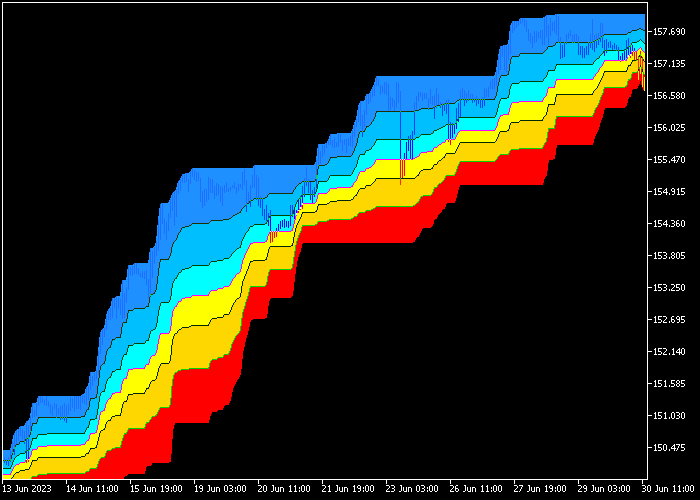
The Donchian Fibonacci Fibo Clouds Indicator overlays colored cloud channels directly on the main price chart.
When the channel slopes upward, the market is in a bullish phase. When it slopes downward, bearish pressure dominates.
The red middle line acts as a pullback entry zone, while the outer blue and red clouds highlight projected take profit areas.
Guide to Trade with Donchian Fibonacci Fibo Clouds Indicator
Buy Rules
- Confirm that the Donchian Fibo channel is clearly rising.
- Wait for price to retrace and touch the red middle line from above.
- Enter a buy trade as price reacts from the middle level.
- Trade only in the direction of the upward channel slope.
Sell Rules
- Confirm that the Donchian Fibo channel is clearly falling.
- Wait for price to retrace and touch the red middle line from below.
- Open a sell trade as price rejects the middle level.
- Trade only in the direction of the downward channel slope.
Stop Loss
- For buy trades, place the stop loss below the lower red cloud boundary.
- For sell trades, place the stop loss above the upper blue cloud boundary.
- Alternatively, use a volatility-based stop aligned with recent price swings.
Take Profit
- For buy trades, target the upper blue cloud as the primary objective.
- For sell trades, target the lower red cloud as the primary objective.
- Close the trade early if the channel direction shifts.
- You may secure partial profits as price approaches the outer cloud band.
Donchian Fibonacci Fibo Clouds Day Trading MT5 Strategy for Beginners
This day trading strategy combines trend direction with precise entry signals to capture strong intraday moves.
It uses the Donchian Fibonacci Fibo Clouds Indicator to define the current trend and dynamic support and resistance, and the Beginner Indicator for timing buy and sell entries.
When both indicators agree, it identifies high‑probability setups during active trading sessions.
The Donchian Fibonacci Fibo Clouds indicator creates a channel based on Donchian and Fibonacci levels.
An upward sloping channel signals a bullish market structure and highlights zones of potential continuation on pullbacks.
A downward sloping channel reflects bearish pressure and identifies resistance areas during downtrends.
The Beginner indicator gives clear entry signals through arrows.
A blue arrow suggests a buy entry while a magenta arrow indicates a sell entry.
This strategy works best on M15 and H1 charts during the London and New York sessions.
It is suitable for major currency pairs and cross pairs that show clear directional behavior during active periods.
Buy Entry Rules
- Confirm that the Donchian Fibonacci Fibo Clouds channel is sloping upward, indicating a bullish trend.
- Wait for a blue arrow from the Beginner indicator signaling a buy opportunity.
- Enter a buy trade at the candle close after the entry arrow appears in the direction of the trend.
- Place the stop loss below the recent swing low, ideally just under the lower cloud boundary.
- Take profit near the next Fibonacci or Donchian resistance level or exit early if a magenta arrow appears.
Sell Entry Rules
- Confirm that the Donchian Fibonacci Fibo Clouds channel is sloping downward, indicating a bearish trend.
- Wait for a magenta arrow from the Beginner indicator signaling a sell entry.
- Enter a sell trade at the candle close following the sell signal arrow.
- Place the stop loss above the recent swing high, ideally just over the upper cloud boundary.
- Take profit near the next Fibonacci or Donchian support level or exit early if a blue arrow appears.
Case Study 1: AUD/USD M15 Buy Setup
During the London session, AUD/USD showed a rising channel on the Donchian Fibonacci Fibo Clouds, indicating a bullish trend on the M15 timeframe.
After a pullback toward the lower cloud, a blue arrow formed on the Beginner indicator, signaling a buy entry aligned with the trend.
A trade was entered at the next candle close, with the stop loss placed below the recent swing low and lower cloud boundary.
Price moved higher steadily and reached the next resistance zone, capturing a strong move before slight consolidation set in.
Case Study 2: GBP/CHF H1 Sell Setup
On the H1 chart, GBP/CHF developed a downward channel as shown by the Donchian Fibonacci Fibo Clouds indicator.
The trend sloped lower for several hours, and after a minor retracement, a magenta arrow appeared on the Beginner indicator signaling a sell entry.
A short position was taken at the next candle, with the stop loss above the recent swing high and upper cloud boundary.
Price continued downward with good momentum, and the trade reached the next support before showing signs of slowing.
Download Now
donchian_fibo_clouds.mq5 Indicator (MT5)
FAQ
How does this indicator define the trend?
The slope of the Donchian Fibonacci channel determines the trend direction.
Rising channels indicate bullish control, while falling channels indicate bearish dominance.
What is the purpose of the red middle line?
The red middle line acts as a dynamic pullback level.
It provides structured entry points within the dominant trend.
Can I adjust the Fibonacci levels?
Yes. The indicator allows modifying the levels and margins, enabling traders to refine how wide or tight the cloud zones appear.
Is it suitable for breakout trading?
While primarily trend-based, it can support breakout strategies when price closes strongly beyond the outer cloud boundaries.
Summary
The Donchian Fibonacci Fibo Clouds Indicator offers a practical way to follow trends while defining precise entry and exit zones.
Its cloud-based layout highlights direction, pullbacks, and profit targets in one integrated view.
Adjustable settings allow traders to fine-tune sensitivity and channel width.
This trading tool can enhance trend confirmation and improve overall trade timing.


