
About the EMA Trend Prediction Indicator
The EMA Trend Prediction Indicator for MT5 is a signal-based tool built around two Exponential Moving Averages.
It identifies potential market reversals and trend continuations through classic EMA crossover logic.
When the faster EMA crosses above the slower EMA from below, the indicator prints a green arrow to signal a potential buy opportunity.
When the faster EMA crosses below the slower EMA from above, a magenta arrow appears to indicate a sell setup.
The indicator simplifies crossover trading by marking entries directly on the price chart.
Traders can adjust the fast EMA period, slow EMA period, applied price, and moving average type to match their strategy.
For scalpers and day traders, the tool performs strongly during the London and New York trading sessions when volatility increases and trends develop with momentum.
Free Download
ema_prediction.mq5 Indicator (MT5)
Key Features
- Generates signals using fast and slow EMA crossovers.
- Green arrows for buy signals and magenta arrows for sell signals.
- Fully customizable EMA periods and price input.
- Simple visual signals for fast decision making.
- Suitable for scalping, intraday, and swing trading.
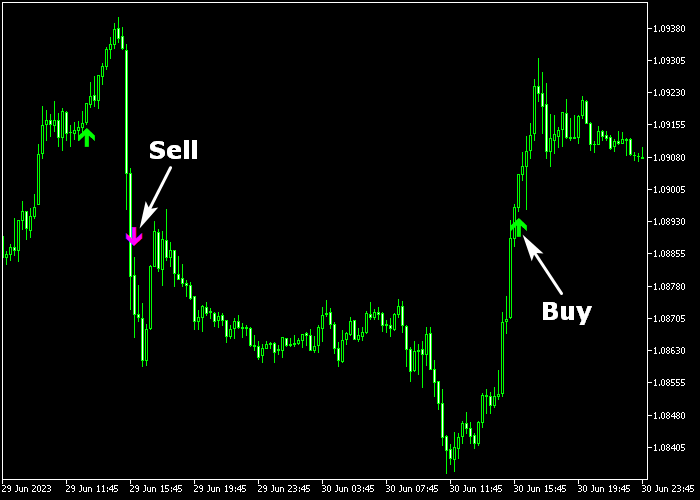
Indicator Chart
The EMA Trend Prediction Indicator plots green and magenta arrows directly on the price action.
A green arrow appears when the fast EMA crosses above the slow EMA. A magenta arrow appears when the fast EMA crosses below the slow EMA.
These arrows highlight potential turning points and developing trend phases.
Guide to Trade with EMA Trend Prediction Indicator
Buy Rules
- Wait for a green EMA trend arrow to appear on the chart.
- Confirm that the fast EMA has crossed above the slow EMA.
- Enter a long position at the opening of the next candle.
- Avoid buying directly into strong resistance levels.
Sell Rules
- Wait for a magenta EMA trend arrow to be printed.
- Confirm that the fast EMA has crossed below the slow EMA.
- Open a short position at the start of the next candle.
- Avoid selling near major support areas.
Stop Loss
- Place the stop loss 3 pips below the most recent swing low for buy trades.
- Place the stop loss 3 pips above the most recent swing high for sell trades.
Take Profit
- Close the buy trade when a magenta arrow appears.
- Close the sell trade when a green arrow appears.
- Alternatively, use a fixed take profit target based on volatility.
EMA Trend Prediction Forex Strategy for MT5
This Forex strategy combines the EMA Trend Prediction Indicator for MT5 with the Power Trend Forex Indicator for MT5.
It is designed to identify strong trend opportunities and align entries with momentum confirmation, making it suitable for multiple timeframes, from M15 to H1 charts.
The EMA Trend Prediction indicator provides clear trend signals using green arrows for bullish trends and magenta arrows for bearish trends.
The Power Trend indicator complements this by plotting blue dotted lines for buy signals and red dotted lines for sell signals, adding an extra layer of confirmation before entering a trade.
This strategy works well for trending markets and can be adapted for swing trading or intraday sessions.
Buy Entry Rules
- Wait for a green arrow from the EMA Trend Prediction indicator, signaling a bullish trend.
- Confirm that the Power Trend indicator shows a blue dotted line, indicating a buy signal.
- Enter a buy trade at the next candle open once both conditions are met.
- Place the stop loss below the recent swing low or just below the signal candle.
- Take profit when a magenta arrow appears or when the Power Trend indicator plots a red dotted line.
Sell Entry Rules
- Wait for a magenta arrow from the EMA Trend Prediction indicator, signaling a bearish trend.
- Confirm that the Power Trend indicator shows a red dotted line, indicating a sell signal.
- Enter a sell trade at the next candle open after both conditions align.
- Place the stop loss above the recent swing high or just above the signal candle.
- Take profit when a green arrow appears or when the Power Trend indicator plots a blue dotted line.
Case Study 1: EUR/GBP H1 Trend Buy
On EUR/GBP H1, a green arrow appeared from the EMA Trend Prediction indicator during a steady uptrend.
At the same time, the Power Trend indicator confirmed a blue dotted buy signal.
A buy trade was executed at the next candle open.
Price continued upward along the trend, reaching a nearby resistance level.
The trade was closed for 45 pips profit when a magenta trend reversal arrow appeared.
Case Study 2: AUD/USD M15 Swing Sell
On AUD/USD M15, a magenta arrow from the EMA Trend Prediction indicator signaled a bearish trend.
Simultaneously, the Power Trend indicator displayed a red dotted sell signal.
A sell trade was entered at the following candle open.
Price moved downward steadily for several candles.
The position was closed when a green arrow appeared, capturing a controlled swing profit while remaining aligned with the dominant trend.
Download Now
ema_prediction.mq5 Indicator (MT5)
FAQ
What makes the EMA Trend Prediction Indicator different from a standard EMA crossover?
It automatically marks crossover points with visual arrows on the chart.
This removes the need to monitor EMA lines manually and speeds up trade execution.
Which EMA settings are best for scalping?
Shorter EMA periods react faster to price changes and generate more signals.
Scalpers often test combinations that respond quickly during high-volume sessions.
Does the indicator work better during specific sessions?
Yes. Many traders report stronger follow-through during the London and New York sessions due to higher liquidity and volatility.
Can I change the moving average type?
Yes. The indicator allows selecting different moving average types and applied price options, giving flexibility in how signals are calculated.
Summary
The EMA Trend Prediction Indicator delivers straightforward trading signals based on proven EMA crossover principles.
Its arrow-based display makes entries easy to identify without overcomplicating the chart.
Adjustable settings allow traders to fine-tune responsiveness and adapt to various trading styles.
With proper session timing, this indicator can support a consistent trend-following approach.


