
About the EMA Crossover Indicator
The EMA Crossover Indicator generates trading signals based on the crossover of two Exponential Moving Averages.
When the fast EMA crosses above the slow EMA, the indicator prints a blue arrow to signal a potential buy opportunity.
When the fast EMA crosses below the slow EMA, a magenta arrow appears to indicate a potential sell setup.
The signals do not repaint once confirmed. This allows traders to evaluate past performance accurately and build confidence in the system.
You can customize the fast and slow EMA periods, arrow style, and arrow colors to match your trading template.
The tool works effectively on its own or alongside additional confirmation methods.
Free Download
ema-crossover_signal.mq5 Indicator (MT5)
Key Features
- Generates signals based on fast and slow EMA crossovers.
- Non-repainting buy and sell arrows.
- Alternating signal logic to prevent duplicate entries.
- Fully customizable EMA periods.
- Adjustable arrow style and visual settings.
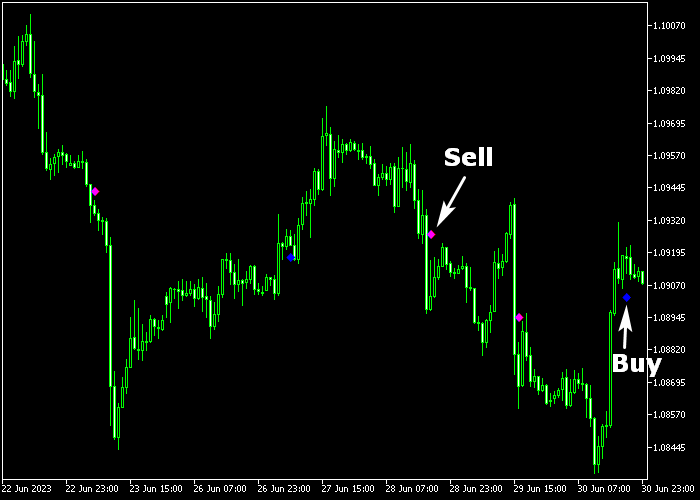
Indicator Chart
The EMA Crossover Indicator displays blue and magenta arrows directly on the price action.
A blue arrow marks a bullish EMA crossover. A magenta arrow marks a bearish crossover.
Signals alternate between buy and sell, helping traders stay aligned with the current directional shift.
Guide to Trade with EMA Crossover Indicator
Buy Rules
- Wait for a blue arrow to appear on the chart.
- Confirm that the fast EMA has crossed above the slow EMA.
- Enter a buy trade at the opening of the next candle.
- Avoid entering if price is reacting strongly to nearby resistance.
Sell Rules
- Wait for a magenta arrow to be printed on the chart.
- Confirm that the fast EMA has crossed below the slow EMA.
- Open a sell trade at the start of the next candle.
- Avoid selling directly into strong support zones.
Stop Loss
- Place the stop loss below the recent swing level low price for buy trades.
- Place the stop loss above the recent swing level high price for sell trades.
Take Profit
- Close the buy trade when a magenta sell arrow appears.
- Close the sell trade when a blue buy arrow appears.
- Alternatively, use a fixed pip target based on market volatility.
- You may scale out partial profits if momentum slows down.
EMA Crossover Scalping Strategy for MT5
This scalping strategy combines the EMA Crossover Indicator with the Indicator Arrows Alert.
It is designed to capture fast intraday moves by aligning crossover signals with trend confirmation from arrow alerts.
The EMA Crossover indicator provides precise entry signals using blue arrows for buys and magenta arrows for sells.
The Indicator Arrows Alert confirms the prevailing trend using green arrows for bullish trends and red arrows for bearish trends.
Using both together helps filter false signals and ensures trades are taken only when momentum aligns with the overall trend.
This strategy is ideal for M1 and M5 charts and works best on pairs with low spreads and high liquidity, such as EUR/USD, GBP/USD, and USD/JPY.
It is suited for scalpers who want fast, clear entries with minimal ambiguity.
Buy Entry Rules
- Wait for a blue arrow from the EMA Crossover indicator signaling a potential buy.
- Confirm that a green arrow appears from the Indicator Arrows Alert, indicating a bullish trend.
- Enter a buy trade at the open of the next candle after both signals align.
- Place the stop loss a few pips below the recent swing low or below the entry candle.
- Take profit when a red arrow appears from the Indicator Arrows Alert or when a magenta sell arrow from the EMA Crossover indicator forms.
Sell Entry Rules
- Wait for a magenta arrow from the EMA Crossover indicator signaling a sell.
- Confirm that a red arrow appears from the Indicator Arrows Alert, indicating a bearish trend.
- Enter a sell trade at the open of the next candle after both signals align.
- Place the stop loss a few pips above the recent swing high or above the entry candle.
- Take profit when a green arrow appears from the Indicator Arrows Alert or when a blue buy arrow from the EMA Crossover indicator forms.
Case Study 1: EUR/USD M5 Scalping Buy
On EUR/USD M5, a blue arrow appeared from the EMA Crossover indicator, signaling a buy opportunity.
At the same time, a green arrow formed from the Indicator Arrows Alert, confirming bullish trend alignment.
A buy trade was entered at the next candle open.
Price moved upward quickly in a short burst.
The trade was closed when a red arrow appeared, securing a fast and controlled scalp.
Case Study 2: GBP/JPY M1 Quick Sell
On GBP/JPY M1, a magenta arrow appeared from the EMA Crossover indicator, indicating a sell signal.
A red arrow from the Indicator Arrows Alert confirmed bearish trend momentum.
A sell trade was opened at the next candle open after both signals aligned.
Price dropped rapidly, following the short-term trend.
The trade was closed for 17 pips when a green arrow appeared, capturing a clean intraday scalp before a potential reversal.
Download Now
ema-crossover_signal.mq5 Indicator (MT5)
FAQ
Does the EMA Crossover Indicator repaint?
No. Once a buy or sell arrow is printed and the candle closes, the signal remains fixed.
What EMA periods should I use?
Shorter EMA combinations generate more signals and suit lower timeframes.
Longer EMA settings filter noise and work better on higher timeframes.
Why do signals alternate between buy and sell?
The indicator is designed to prevent consecutive signals in the same direction.
It waits for an opposite crossover before printing a new arrow, keeping trading decisions disciplined.
Summary
The EMA Crossover Indicator delivers straightforward buy and sell signals based on proven moving average crossover logic.
Its non-repainting arrows allow consistent evaluation and reliable execution.
Customizable settings give traders full control over sensitivity and signal frequency.
This indicator can support a systematic trend-following trading approach.


