
About the Daily Price Prediction Indicator
The Daily Price Prediction Indicator for MT5 projects tomorrow’s expected high and low levels directly on the price window.
It provides traders with forward-looking reference points that can be used for entries, exits, and trade management decisions.
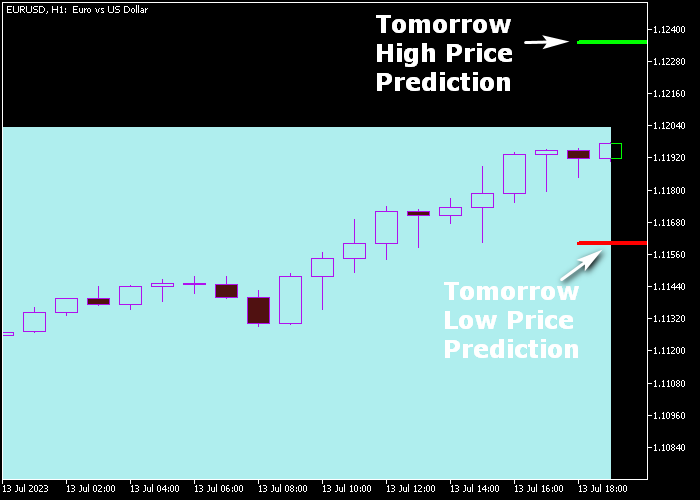
The green solid line represents the projected high for the next trading day. The red solid line represents the projected low.
These levels act as potential resistance and support zones where price may react.
Traders can customize settings such as the trigger level and prediction values to better align with their strategy.
The indicator works across all instruments available on the MT5 platform, including Forex pairs, commodities, indices, and stocks.
Free Download
i-drprojections.mq5 Indicator (MT5)
Key Features
- Projects tomorrow’s expected high and low levels.
- Displays clear green and red prediction lines.
- Helps define stop loss and take profit zones.
- Supports entry planning around projected extremes.
- Customizable trigger and prediction parameters.
- Suitable for intraday and short-term swing trading.
Indicator Chart
The Daily Price Prediction Indicator is plotted directly in the main price window, showing two horizontal prediction lines for the upcoming trading day.
The green line marks the projected high and acts as potential resistance. The red line marks the projected low and acts as potential support.
Traders monitor how price behaves when approaching these levels to plan trades.
Guide to Trade with the Daily Price Prediction Indicator
Buy Rules
- Wait for the price to approach or touch the red projected low line.
- Look for a bullish reaction near the predicted support zone.
- Open a buy position after confirmation from price behavior.
- Ensure the trade aligns with the overall bullish daily bias.
Sell Rules
- Wait for the price to approach or touch the green projected high line.
- Look for a bearish reaction near the predicted resistance zone.
- Open a sell position after confirmation from price behavior.
- Ensure the trade aligns with the overall bearish daily bias.
Stop Loss
- Place the stop loss below the red projected line for buy trades.
- Place the stop loss above the green projected line for sell trades.
Take Profit
- For buy trades, consider exiting near the projected high line.
- For sell trades, consider exiting near the projected low line.
- Alternatively, use a fixed pip target based on your trading plan.
Daily Price Prediction Intraday Strategy for MT5
This day trading strategy combines the Daily Price Prediction Indicator for MT5 with the Super Signals Indicator MT5.
It focuses on using projected daily levels together with clear entry signals to catch structured intraday moves.
The approach works because it aligns price reaction zones with momentum-based signals.
The Daily Price Prediction indicator highlights expected high and low levels, giving you key areas to watch.
The Super Signals indicator then confirms entries with visual arrows based on price action and momentum, which helps traders avoid guessing entries.
It performs strongly on M15 and M30 timeframes and works well across major and minor currency pairs.
Buy Entry Rules
- Wait for price to approach or bounce from the projected daily low level.
- Look for a blue arrow from the Super Signals Indicator as confirmation.
- Enter a buy trade at the close of the signal candle.
- Place stop loss below the recent swing low or slightly below the predicted daily low.
- Take profit when an opposite magenta arrow appears or near the projected daily high level.
Sell Entry Rules
- Wait for price to approach or reject the projected daily high level.
- Look for a magenta arrow from the Super Signals Indicator as confirmation.
- Enter a sell trade at the close of the signal candle.
- Place stop loss above the recent swing high or slightly above the predicted daily high.
- Take profit when an opposite blue arrow appears or near the projected daily low level.
Case Study 1: EUR/USD Day Trade
On EUR/USD M15, price moved down early in the session and touched the projected daily low.
Shortly after, a blue arrow appeared, signaling a potential reversal.
The trade was opened at candle close and price started pushing higher.
The move continued steadily toward the projected daily high area.
The position was closed when a magenta arrow appeared, locking in intraday profits from the reversal zone.
Case Study 2: AUD/JPY Intraday Setup
On AUD/JPY M30, price climbed into the projected daily high during the London session.
A magenta arrow formed at the resistance zone, confirming selling pressure.
A sell trade was taken at candle close. Price reacted strongly and moved lower throughout the session.
The position was closed when a blue arrow appeared near the projected daily low, completing a clean day trading cycle.
Download Now
i-drprojections.mq5 Indicator (MT5)
FAQ
Are the projected levels recalculated every day?
Yes. The indicator updates its projected high and low levels daily to reflect new market data.
Can I modify the prediction settings?
Yes. You can adjust trigger levels and prediction inputs to better suit your trading style and instrument volatility.
Is this indicator suitable for all markets?
It works on all instruments available on MT5, including Forex, Gold, indices, and stocks.
Should I trade directly at the prediction lines?
It is best to wait for confirmation through price action before entering trades near projected high or low levels.
Summary
The Daily Price Prediction Indicator provides forward-looking high and low levels that help traders plan entries and exits with precision.
By projecting tomorrow’s expected range, it gives structure to daily trading decisions and improves risk management.
For traders who prefer defined targets and support resistance planning, this indicator offers a practical and disciplined approach.


