About the Market Profile Indicator
The Market Profile Indicator for MT5 provides insight into areas of high trading activity during different Forex sessions: Asian, European, and American.
It highlights market participation levels, helping traders identify potential support, resistance, and trend reversal points.
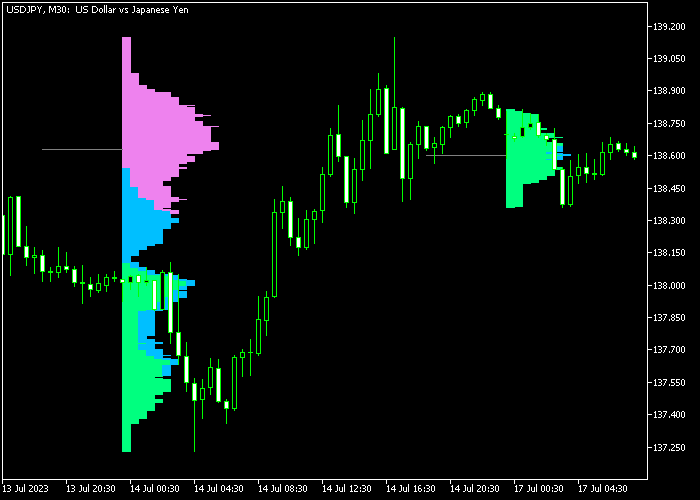
The indicator uses specific colors to represent sessions: green for Asian, blue for European, violet for American, and gray for the median line.
A price above the previous day’s gray median line signals bullish conditions, while a price below indicates bearish conditions.
Customizable parameters include start date, last day start, count profile, and colors for each session.
Traders are encouraged to combine the Market Profile indicator with other tools for more reliable signals and to practice on a demo account before live trading.
Free Download
marketprofile.mq5 Indicator (MT5)
Key Features
- Displays trading activity for Asian, European, and American sessions.
- Median line highlights the previous day’s central price level.
- Identifies bullish and bearish trends using median line breaks.
- Customizable session colors, start dates, and profile counts.
- Helps traders pinpoint areas of high market interest for better entries.
Indicator Chart
The Market Profile Indicator displays session activity in distinct colors below or over the main price area.
The gray median line represents the previous day’s central price, serving as a key reference for bullish and bearish market conditions.
Traders can observe how price interacts with the median and session profiles to identify entry points and potential reversals for improved trade timing.

Guide to Trade with Market Profile Indicator
Buy Rules
- Confirm that the candle closes above the previous day’s gray median line.
- Look for alignment with bullish momentum or trend indicators for stronger confirmation.
- Enter a buy trade as the price sustains above the median line.
- Monitor session activity to anticipate potential resistance or reversal points.
Sell Rules
- Confirm that the candle closes below the previous day’s gray median line.
- Look for alignment with bearish momentum or trend indicators for stronger confirmation.
- Enter a sell trade as the price sustains below the median line.
- Monitor session activity to anticipate potential support or reversal points.
Stop Loss
- For buy trades, place the stop loss just below the nearest session support or value area low.
- For sell trades, place the stop loss just above the nearest session resistance or value area high.
- Optionally, use trailing stops along session levels as price moves in your favor.
Take Profits
- For buy trades, take profits near the next session resistance or high volume node.
- For sell trades, take profits near the next session support or low volume node.
- Use price action or momentum indicators to refine exit points.
Market Profile and RSI Bollinger Bands MT5 Scalping Strategy
This scalping strategy combines daily market structure with short-term momentum signals to capture quick intraday gains.
It uses the Market Profile Indicator for MT5 to determine the overall trend and the RSI Bollinger Bands Indicator for MT5 to time entries on M1 and M5 charts.
The Market Profile indicator highlights key daily levels.
A candle closing above the previous day’s gray median line signals a bullish trend, while a close below indicates a bearish trend.
This provides a reliable short-term trend bias for scalping trades.
The RSI Bollinger Bands indicator generates precise entry signals with arrows.
Combining these signals with the market profile trend helps filter trades and improve accuracy.
This strategy is ideal for fast-moving sessions during London and New York hours and works well on major currency pairs with high liquidity.
Buy Entry Rules
- Confirm that the candle closes above the previous day’s gray median line, indicating a bullish trend.
- Wait for a green arrow from the RSI Bollinger Bands indicator.
- Enter a buy trade at the open of the next candle after both conditions align.
- Place the stop loss below the recent swing low or just under the median line.
- Take profit quickly, targeting 5–20 pips, or exit if the RSI arrow turns red or price drops back below the median line.
Sell Entry Rules
- Confirm that the candle closes below the previous day’s gray median line, signaling a bearish trend.
- Wait for a red arrow from the RSI Bollinger Bands indicator.
- Enter a sell trade at the next candle open after confirmation.
- Set the stop loss above the recent swing high or just above the median line.
- Target 5–20 pips for quick gains or close the trade if the RSI arrow turns green or price moves above the median line.
Case Study 1: EUR/USD M1 Scalping
During a London session, EUR/USD closed above the previous day’s gray median line, signaling a bullish trend.
Shortly after, the RSI Bollinger Bands indicator printed a green arrow.
A buy trade was placed at the next candle, with the stop loss below the recent swing low.
Price moved sharply higher, and the trade captured 7 pips before momentum paused.
Case Study 2: GBP/JPY M5 Scalping
On the M5 chart, GBP/JPY closed below the previous day’s median line, indicating a bearish bias.
A red RSI arrow appeared after a small retracement, confirming a sell entry.
The trade was opened at the following candle with the stop loss above the recent swing high.
Price fell steadily, and the position gained 18 pips before the arrow signaled a potential reversal.
Download Now
marketprofile.mq5 Indicator (MT5)
FAQ
What does the gray median line represent?
The gray median line shows the central price of the previous day’s trading activity.
It helps identify whether the market is bullish or bearish relative to the prior session.
Can session colors be customized?
Yes. Traders can change the colors for Asian, European, and American sessions, as well as the median line, to match their charting preferences.
Should I combine it with other indicators?
Yes. Combining with trend, momentum, or support/resistance indicators increases the accuracy of trade entries and exit points.
Summary
The Market Profile Indicator highlights session-specific trading activity, helping traders identify bullish and bearish conditions using the previous day’s median line.
Price above the median signals a buy bias, while price below signals a sell bias.
With customizable session colors, adjustable parameters, and compatibility with all timeframes and instruments, this indicator is suitable for scalping, intraday, and swing trading.
Monitoring market activity during different sessions provides traders with a deeper understanding of supply and demand dynamics and improves trade timing.


