
About the Grid Lines Indicator
The Grid Lines Indicator for MT5 plots horizontal grid lines on the chart, emphasizing key round number levels.
These levels act as natural support and resistance zones, helping traders make better entry decisions.
The indicator allows full customization of intervals, line style, color, and width.
You can adjust the number of lines and their spacing to match your trading style and preferred timeframes.
Free Download
mfcs_gridlines.mq5 Indicator (MT5)
Key Features
- Displays horizontal grid lines highlighting round number levels.
- Customizable line interval, style, color, and width.
- Adjustable number of lines for a tailored chart view.
- Compatible with all timeframes and MT5 instruments.
- Helps identify potential support and resistance levels for trading entries.
- Easy to use for both beginners and experienced traders.
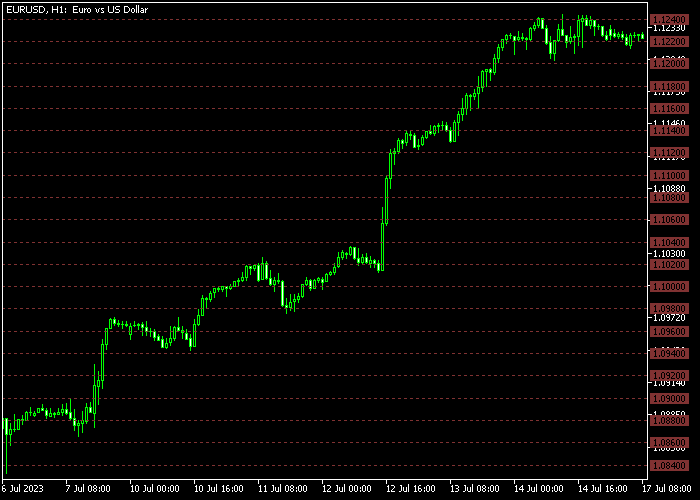
Indicator Chart
The Grid Lines Indicator draws horizontal lines across the main price area at round number levels.
These levels act as psychological support and resistance zones that traders can use to anticipate potential price reactions.
By observing price interactions with these grid lines, traders can plan buy or sell entries at key levels, increasing precision and timing in trades.
Guide to Trade with Grid Lines Indicator
Buy Rules
- Enter a buy trade when the price approaches a strong grid support level and shows signs of bouncing upward.
- Confirm bullish momentum using candlestick patterns or additional trend indicators.
- Look for price consolidations near the support grid before initiating the trade.
- Consider multiple timeframes to validate the strength of the support level.
Sell Rules
- Enter a sell trade when the price nears a strong grid resistance level and shows signs of reversing downward.
- Confirm bearish momentum using candlestick patterns or additional trend indicators.
- Observe price reactions to the resistance grid before placing the trade.
- Use higher timeframes to confirm the resistance level’s significance.
Grid Lines Indicator and Solar Winds MT5 Intraday Strategy
This intraday Forex strategy combines momentum signals with precise take profit targeting using key levels.
It uses the Solar Winds Forex Indicator for MT5 for trade entries and the Grid Lines Forex Indicator for MT5 to determine take profit targets at key round number levels.
The Solar Winds indicator provides a momentum-based histogram.
A green histogram above zero signals a potential buy, while a red histogram below zero indicates a potential sell.
This gives traders clear entry points based on current market momentum.
The Grid Lines indicator plots horizontal lines at key round number levels.
These lines act as natural take profit or partial exit targets, helping traders scale out of positions efficiently and manage risk more effectively.
This strategy works best on M15 and H1 charts during active trading sessions.
It is suitable for major currency pairs and commodities where round number levels tend to act as intraday support and resistance.
Buy Entry Rules
- Wait for the Solar Winds histogram to turn green and move above zero, signaling a buy opportunity.
- Confirm that the overall trend is aligned with the direction of the entry (optional trend filter).
- Enter a buy trade at the next candle open after confirmation.
- Place the stop loss below the recent swing low or just below a nearby support level.
- Set take profit at the next Grid Lines horizontal level above the entry, or scale out at multiple nearby levels for partial profits.
Sell Entry Rules
- Wait for the Solar Winds histogram to turn red and move below zero, signaling a sell opportunity.
- Confirm alignment with the prevailing trend (optional).
- Enter a sell trade at the opening of the next candle after confirmation.
- Place the stop loss above the recent swing high or just above a nearby resistance level.
- Target the nearest Grid Lines horizontal line below the entry for take profit, or scale out gradually at multiple levels.
Case Study 1: EUR/USD M15 Buy
During the London session, EUR/USD showed upward momentum as the Solar Winds histogram turned green above zero.
A trade was opened at the next candle, with the stop loss placed below the recent swing low.
The nearest Grid Lines horizontal line above acted as the take profit target.
Price moved quickly toward this level, and the trade captured 15 pips before a minor retracement.
Case Study 2: GBP/JPY H1 Sell
On the H1 chart, GBP/JPY displayed a downtrend, and the Solar Winds histogram dropped below zero, signaling a sell opportunity.
A short position was entered at the following candle, with the stop loss set above the recent swing high.
The nearest Grid Lines horizontal line below the entry served as the take profit target.
Price declined steadily and reached the level, capturing 47 pips before a temporary consolidation.
Download Now
mfcs_gridlines.mq5 Indicator (MT5)
FAQ
Can I adjust the spacing of the grid lines?
Yes. You can customize the interval between lines to suit your trading style and preferred chart analysis.
Does it work on all timeframes?
Yes. The Grid Lines Indicator is compatible with all MT5 timeframes, from M1 scalping charts to H4 or daily swing setups.
Can I change the colors and styles of the lines?
Absolutely. Each line’s color, style, and width can be modified for better visibility or personal preference.
Summary
The Grid Lines Forex Indicator highlights round number levels as natural support and resistance zones.
Traders can use these levels to plan buy and sell entries, improving timing and accuracy.
With fully customizable lines, compatibility across all instruments and timeframes, and ease of use, this indicator is suitable for scalping, intraday, and swing trading strategies.
Observing price reactions at grid levels helps traders make more informed trading decisions.


