About the Key Market Murray Levels Indicator
The Key Market Levels Indicator for MT5 uses Murray levels derived from pivot points to identify critical support and resistance zones.
These levels help traders spot potential trend reversals, set stop losses, and determine take profit points efficiently.
When the currency pair trades above the [0/8]P pivot line, the market is considered bullish, signaling potential buy opportunities.
Conversely, when the pair trades below [0/8]P, the market is bearish, signaling potential sell opportunities.
Traders can use intermediate Murray levels for precise exits or to manage risk effectively.
The indicator allows customization of line colors, styles, and other parameters to suit your trading preferences.
It works on all timeframes and trading instruments.
Free Download
mmlevls_vg.mq5 Indicator (MT5)
Key Features
- Displays Murray levels derived from pivot points for clear support and resistance zones.
- Identifies bullish and bearish market states using the [0/8]P line.
- Intermediate levels can be used for stop-loss placement and take-profit targets.
- Customizable line colors and styles for each level.
- Compatible with all timeframes and MT5 instruments.
- Assists with trade entry timing, risk management, and exit planning.
- Suitable for both scalping and intraday trading strategies.
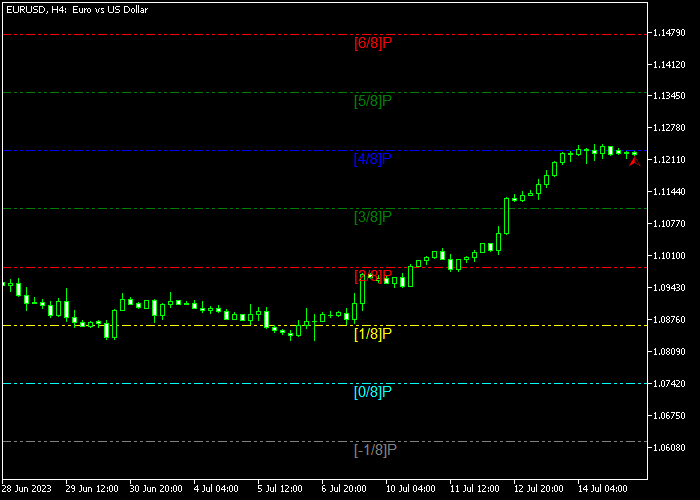
Indicator Chart
The Key Market Levels Indicator shows pivot-based Murray levels on the main chart.
The [0/8]P line is highlighted in light blue, marking the central pivot.
Price above this level indicates bullish conditions, and price below indicates bearish conditions.
Traders can use the levels above and below [0/8]P to plan take profits or place stop-loss orders.
The visual guidance simplifies trade management and helps identify potential reversals in real time.

Guide to Trade with Key Market Levels Indicator
Buy Rules
- Open a buy trade when price rises above the [0/8]P pivot line from below.
- Confirm bullish momentum with recent higher lows or trend indicators.
Sell Rules
- Open a sell trade when price drops below the [0/8]P pivot line from above.
- Confirm bearish momentum with recent lower highs or trend indicators.
Stop Loss
- For buy trades, place the stop loss just below the nearest Murray support line.
- For sell trades, place the stop loss just above the nearest Murray resistance line.
- Adjust stop distance according to recent price swings for better risk management.
Take Profits
- Close buy trades at the next resistance levels above the entry price.
- Close sell trades at the next support levels below the entry price.
- Optionally, scale out partial positions at intermediate Murray levels.
- Combine with trend confirmation for improved exit timing.
Key Market Levels and BB Stops 2 MACD Intraday Strategy for MT5
This intraday Forex strategy combines key support and resistance analysis with precise entry signals to capture high-probability moves during active sessions.
It uses the Key Market Levels Forex Indicator for MT5 to gauge bullish or bearish zones and the BB Stops 2 MACD Indicator for MT5 for timing entries.
The Key Market Levels indicator identifies crucial intraday levels.
A candle closing above the [0/8]P level signals a bullish environment, while a candle below indicates bearish pressure.
These levels act as dynamic support and resistance and help filter trades with the trend.
The BB Stops 2 MACD indicator provides entry signals with colored lines.
A blue line indicates a buy opportunity, while an orange line signals a sell setup.
Together, these indicators allow traders to enter at high-probability points with the market aligned.
It is suitable for major and cross currency pairs such as EUR/JPY, GBP/USD, and AUD/USD.
Buy Entry Rules
- Confirm that the candle closes above the [0/8]P level, indicating bullish conditions.
- Wait for the BB Stops 2 MACD blue line to appear, signaling a buy entry.
- Enter a buy trade at the next candle open after both conditions align.
- Place the stop loss below the recent swing low or below the [0/8]P level for protection.
- Take profit near the next resistance or exit if the BB Stops 2 MACD line turns orange.
Sell Entry Rules
- Ensure the candle closes below the [0/8]P level, indicating bearish conditions.
- Wait for the BB Stops 2 MACD orange line to appear, confirming a sell entry.
- Enter a sell trade on the next candle after confirmation.
- Place the stop loss above the recent swing high or above the [0/8]P level.
- Take profit near the next support or exit early if the BB Stops 2 MACD line turns blue.
Case Study 1: EUR/JPY M15 Intraday Trade
During the London session, EUR/JPY candles closed above the [0/8]P level, signaling bullish conditions.
Shortly after, the BB Stops 2 MACD line turned blue, confirming a buy entry.
A trade was opened on the next candle with the stop loss placed below the [0/8]P level.
Price climbed steadily, and the trade captured 18 pips before the MACD line showed signs of weakening.
Case Study 2: AUD/USD M30 Intraday Short
On the M30 chart, AUD/USD traded below the [0/8]P level during a New York session, indicating bearish pressure.
An orange BB Stops 2 MACD line appeared, signaling a sell entry.
A short trade was placed with the stop loss above the recent swing high.
Price moved down quickly, and the position reached 20 pips before a minor pullback suggested taking profits.
Download Now
mmlevls_vg.mq5 Indicator (MT5)
FAQ
What are Murray levels?
Murray levels are support and resistance levels derived from pivot points.
They divide price ranges into fractional levels, helping traders identify key areas for entry, exit, and stop placement.
Can I customize the indicator’s colors and lines?
Yes. Each level can be adjusted for color and line style, making it easier to read on your chart and match your trading preferences.
Which timeframes are best for using this indicator?
The indicator works on all timeframes.
Scalpers may prefer M5–M15, while day traders and swing traders may use H1–H4 for broader trend analysis.
Do I need other indicators with this tool?
It can be used independently, but combining with trend indicators or oscillators can help confirm entries and reduce false signals.
Summary
The Key Market Levels Indicator for MT5 provides a structured approach to trading using Murray levels.
Price above [0/8]P signals bullish setups, while price below indicates bearish setups.
Intermediate levels allow precise stop loss and take profit placement.
Its flexibility, customization options, and compatibility with all instruments and timeframes make it suitable for scalping, day trading, and swing trading.
By visually mapping key market levels, traders can manage risk more effectively and time entries and exits with confidence.


