
About the RD Forecast Oscillator
The RD Forecast Oscillator Indicator for MT5 generates multiple daily trading signals by combining momentum analysis with forecasted market direction.
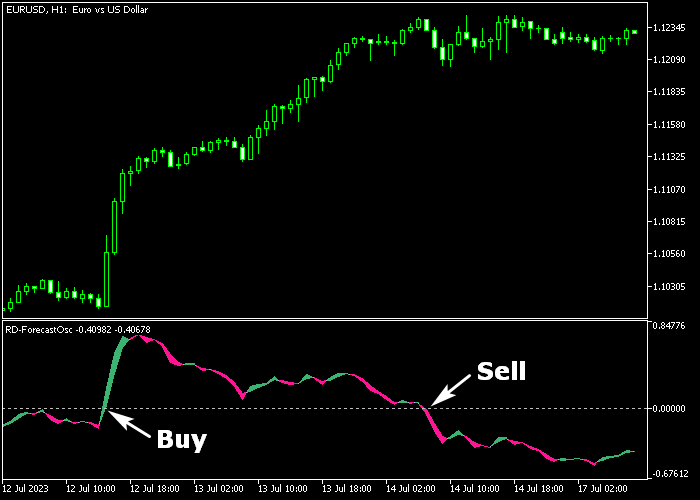
It displays a green and magenta line in a separate oscillator window, helping traders gauge bullish and bearish sentiment at a glance.
A bullish market sentiment is indicated when the oscillator moves above zero.
A bearish market sentiment is indicated when it moves below zero.
By combining this indicator with the ADX, traders can focus on signals that occur during strong trending conditions for better accuracy.
This indicator is suitable for scalpers and day traders, particularly during high-volatility sessions like London and New York.
Free Download
rd-forecastosc.mq5 Indicator (MT5)
Key Features
- Displays green and magenta lines reflecting bullish and bearish momentum.
- Zero-line crossing signals provide buy and sell opportunities.
- Customizable inputs: length, T3, b parameter, and applied price.
- Combines effectively with ADX for strong trend confirmation.
- Best used during high-volatility sessions.
- Suitable for scalping and day trading strategies.
- Oscillator displayed in a separate chart window for clarity.
Indicator Chart
The RD Forecast Oscillator Indicator displays oscillating green and magenta lines below the main price area.
Crosses above zero signal bullish sentiment; crosses below zero indicate bearish sentiment.
When combined with an ADX reading above 25, signals in the direction of the trend are considered stronger and more reliable.
Traders use this setup to enter trades aligned with both momentum and trend strength.
Guide to Trade with RD Forecast Oscillator Indicator
Buy Rules
- The oscillator must cross back above zero.
- ADX should be above 25, confirming a strong bullish trend.
- Open a buy trade at the close of the crossover candle.
- Ensure overall market conditions support upward momentum.
Sell Rules
- The oscillator must cross back below zero.
- ADX should be above 25, confirming a strong bearish trend.
- Open a sell trade at the close of the crossover candle.
- Ensure overall market conditions support downward momentum.
Stop Loss
- For buy trades, place the stop loss slightly below recent swing support.
- For sell trades, place the stop loss slightly above recent swing resistance.
- Consider ATR-based distance to adjust for volatility.
Take Profits
- Close the buy trade at a predetermined pip target or when the oscillator turns below zero.
- Close the sell trade at a predetermined pip target or when the oscillator turns above zero.
- Optionally, trail profits while the oscillator continues in favor of your trade.
- Consider combining with support/resistance levels to improve exit timing.
RD Forecast Oscillator MT5 Trend Strategy for EUR/USD
This trend-following strategy combines the RD Forecast Oscillator Indicator with the Vortex Trend Indicator to trade the EUR/USD pair with clarity and structure.
The approach focuses on aligning momentum shifts with trend direction, which helps reduce false entries and improves timing.
The RD Forecast Oscillator measures momentum around the zero level, making it effective for spotting shifts in market direction.
The Vortex Trend Indicator acts as a directional filter by highlighting bullish or bearish conditions through its colored histogram.
This combination ensures trades follow the prevailing trend while entering on fresh momentum.
It is suitable for EUR/USD currency traders who prefer structured trend trading with clear confirmation signals rather than aggressive entries.
Buy Entry Rules
- Wait for the RD Forecast Oscillator to cross back above the zero level from below.
- Confirm that the Vortex Trend histogram is green, indicating bullish momentum.
- Enter a buy trade at the opening of the next candle after confirmation.
- Place the stop loss below the most recent swing low area.
- Take profit when the oscillator starts turning down toward zero or when the Vortex histogram shifts to gray or red.
Sell Entry Rules
- Wait for the RD Forecast Oscillator to cross below the zero level from above.
- Ensure the Vortex Trend histogram is red, confirming bearish conditions.
- Open a sell trade at the next candle after both signals align.
- Set the stop loss above the recent swing high cluster.
- Exit the trade when momentum weakens and the oscillator moves back toward zero or the histogram turns neutral.
Case Study 1: EUR/USD Buy Trade
During the London session, EUR/USD on the M1 trading chart showed a gradual pullback before momentum shifted upward.
The RD Forecast Oscillator crossed above the zero line, signaling renewed bullish pressure.
At the same time, the Vortex Trend histogram turned green and began expanding, reflecting a strengthening trend.
A buy position was taken immediately after confirmation. Price continued to climb steadily as momentum remained strong.
The position was exited when the oscillator flattened and started to curve downward, securing a gain of 11 pips.
Case Study 2: EUR/USD Sell Trade
In the New York session, EUR/USD on the M5 chart entered a short-term topping phase.
The RD Forecast Oscillator dropped below the zero level, indicating bearish momentum.
Simultaneously, the Vortex histogram shifted to red, confirming downward pressure.
A sell trade was executed on the next candle. Price declined with consistent bearish movement as both indicators remained aligned.
The trade reached its target area and delivered 31 pips before momentum began to fade and conditions turned neutral.
Download Now
rd-forecastosc.mq5 Indicator (MT5)
FAQ
Why use ADX with the RD Forecast Oscillator?
ADX measures trend strength.
Using it ensures you take trades only during strong trending conditions, reducing false signals during sideways markets.
Can I adjust the oscillator settings?
Yes. You can modify the length, T3 smoothing, b parameter, and applied price to fine-tune signal sensitivity according to your trading style.
Which timeframes are most effective?
The indicator works well on M5, M15, and H1 charts. Higher volatility during these periods provides more reliable zero-line crossings.
Summary
The RD Forecast Oscillator Indicator generates actionable buy and sell signals using zero-line crossings.
Green and magenta lines visually indicate bullish and bearish momentum, while combining with ADX filters for strong trends improves trade reliability.
Designed for scalpers and day traders, it provides a structured approach for trading intraday price movements.
Proper session selection is key to maximizing the indicator’s effectiveness.


