About the RSI Filter Indicator
The RSI Filter Indicator for MT5 delivers robust RSI-based scalping signals through colored histogram bars displayed in a dedicated indicator window.
It simplifies short-term trend detection by converting RSI momentum into clear bullish and bearish bars.
Instead of manually interpreting RSI levels, traders can react to color changes in the histogram.
A green bar reflects bullish pressure and potential upward continuation. A magenta bar reflects bearish pressure and possible downward movement.
This indicator suits scalpers and day traders who focus on capturing quick intraday moves.
It can be used as a standalone scalping tool or combined with your existing trading strategy for additional confirmation.
Free Download
Key Features
- Displays RSI momentum as green and magenta histogram bars.
- A green bar signals potential buy opportunities.
- A magenta bar signals potential sell opportunities.
- Customizable RSI period for faster or smoother signals.
- Adjustable overbought and oversold levels.
- Works effectively on lower timeframes for scalping.
- Can confirm short-term trends when combined with other tools.
Indicator Chart
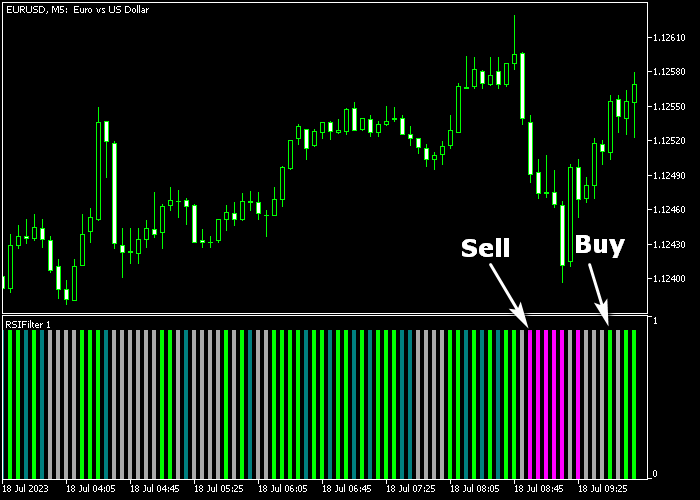
The RSI Filter Indicator appears in a separate window beneath the main price chart, printing green and magenta histogram bars that reflect short-term momentum shifts.
The first green bar after a bearish sequence often signals a bullish reversal setup.
The first magenta bar after a bullish sequence often indicates potential downward continuation.

Guide to Trade with RSI Filter Indicator
Buy Rules
- The first green RSI histogram bar must appear after a bearish phase.
- Confirm price reacts near short-term support or shows bullish intent.
- Open a buy market order at the close of the green bar.
Sell Rules
- The first magenta RSI histogram bar must appear after a bullish phase.
- Confirm price reacts near short-term resistance or shows bearish intent.
- Open a sell market order at the close of the magenta bar.
Stop Loss
- For buy trades, place the stop loss slightly below short-term support.
- For sell trades, place the stop loss slightly above short-term resistance.
- Keep risk small to match the short-term scalping objective.
Take Profits
- Close the buy trade within a 5 to 20 pip target, depending on the timeframe.
- Close the sell trade within a 5 to 20 pip target, depending on the timeframe.
- Alternatively, exit the buy trade when a magenta bar appears.
- Alternatively, exit the sell trade when a green bar appears.
RSI Filter and Hull Moving Average Trend Trading Strategy for MT5
This trend trading strategy focuses on capturing sustained market moves using momentum confirmation and a responsive trend filter.
It combines the RSI Filter Indicator MT5 with the Hull Moving Average HMA Indicator for MT5 to build a structured approach for M15 and H1 trading.
The RSI Filter indicator improves traditional RSI signals by smoothing out noise and highlighting stronger momentum shifts.
This helps traders avoid weak entries and focus on clearer directional signals.
The Hull Moving Average acts as a dynamic trend guide. A green line indicates an uptrend, while an orange line signals a downtrend.
This combination works well because it separates roles clearly.
The HMA defines the trend, while the RSI Filter confirms momentum within that trend.
It performs strongly on major pairs as well as indices and metals.
Buy Entry Rules
- Confirm that the Hull Moving Average is green, showing a bullish trend.
- Wait for the RSI Filter histogram to turn green after a pullback.
- Enter a buy trade when price respects the HMA and momentum shifts upward.
- Place the stop loss below the recent swing low or slightly under the HMA line.
- Take profit when the RSI histogram turns magenta or when the HMA changes color to orange.
Sell Entry Rules
- Confirm that the Hull Moving Average is orange, indicating a bearish trend.
- Wait for the RSI Filter histogram to turn magenta after a retracement.
- Enter a sell trade once momentum aligns with the trend direction.
- Place the stop loss above the recent swing high or slightly above the HMA line.
- Take profit when the RSI histogram turns green or when the HMA flips to green.
Case Study 1: GBP/USD H1 Trend Continuation
On the H1 timeframe, GBP/USD established a strong upward trend with the Hull Moving Average clearly turning green.
Price pulled back toward the HMA, creating a temporary pause in momentum.
During this pullback, the RSI histogram briefly turned magenta before shifting back to green.
A buy position was opened once the green histogram reappeared, confirming renewed bullish strength.
The stop loss was placed below the pullback low. Price continued trending higher with steady momentum.
The trade reached its target near a resistance area, securing 47 pips.
Case Study 2: USD/CHF M15 Intraday Downtrend
During an active London session, USD/CHF showed a clear bearish structure on the M15 timeframe.
The Hull Moving Average remained orange, confirming the downtrend. Price retraced upward briefly before losing strength.
As the RSI Filter histogram turned magenta again, a sell trade was triggered.
The stop loss was placed just above the recent retracement high. Price resumed its downward movement with strong momentum.
The short position was exited when the histogram flipped back to green, capturing 18 pips.
Download Now
FAQ
Can the RSI Filter Indicator be used alone?
Yes. Many traders use it as a standalone scalping tool.
It can also strengthen existing strategies by confirming short-term momentum direction.
Which timeframes are best for this indicator?
It performs effectively on lower timeframes such as M1, M5, and M15.
These intervals generate more frequent signals suited for intraday trading.
Can I adjust RSI settings?
Yes. You can customize the RSI period, applied price, and overbought and oversold levels.
Shorter periods produce more signals, while longer periods filter minor fluctuations.
Should I test before trading live?
Yes. It is strongly recommended to test the RSI Filter Indicator on a demo account for an extended period.
This helps you understand signal frequency and performance under varying market conditions.
Summary
The RSI Filter Indicator transforms standard RSI data into practical histogram signals that support quick decision-making.
Green and magenta bars highlight short-term bullish and bearish shifts with clarity.
It supports scalpers and day traders aiming for 5 to 20 pip targets.
When combined with proper session timing, it can become a consistent tool for short-term trading execution.


