
About the Force MACD Signal Indicator
The Force MACD Signal indicator is a technical tool designed for the MetaTrader 5 platform that combines traditional momentum analysis with force volume calculations.
It utilizes the standard Moving Average Convergence Divergence logic but enhances it by integrating a force component that weighs price changes against volume.
The primary function of this tool is to provide a clear perspective on market momentum through its color-coded histogram.
When the force behind a move aligns with the MACD crossover, the indicator generates a signal.
Traders benefit from this approach because it filters out weak price fluctuations that often lead to false entries.
It serves as a reliable trend-following system that helps you stay on the right side of the market during volatile sessions.
Free Download
tsd_pp_macd_force_ind_v1.mq5 Indicator (MT5)
Key Features
- Integrated force value calculations that filter out low-volume price movements.
- Dual-colored histogram bars that instantly identify the prevailing market trend.
- Customizable parameters for fast and slow moving averages to suit different timeframes.
- Real-time signal generation at the beginning of new momentum shifts.
- Adjustable volume type settings to align with specific broker data feeds.
- User-friendly interface that sits neatly at the bottom of the trading terminal.
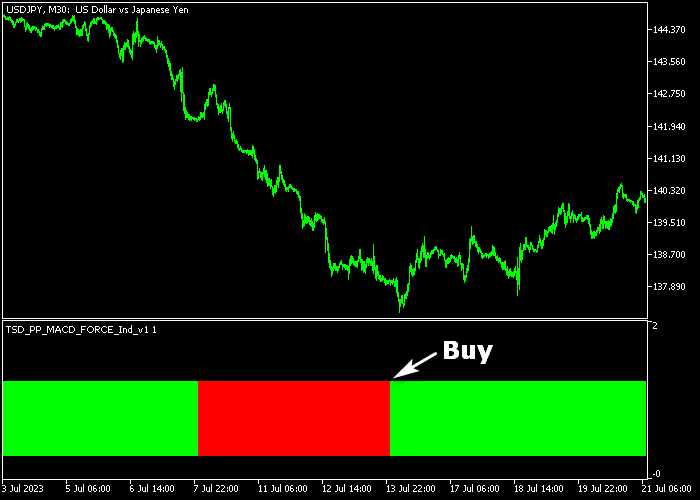
Indicator Chart
The Force MACD Signal indicator chart displays green and red histogram bars positioned in a separate window below the main price action.
The green bars appear when bullish momentum is accelerating, while red bars indicate a shift toward a bearish trend.
This layout allows you to confirm entries by matching the histogram color with the current price direction.
Guide to Trade with Force MACD Signal Indicator
Buy Rules
- Wait for the histogram bars to change color from red to green.
- The appearance of the first green bar confirms an upside momentum shift.
- Enter a buy order at the opening of the candle following the green bar.
Sell Rules
- Monitor the histogram for a transition from green colored bars to red.
- The first red bar serves as the primary signal that sellers are taking over.
- Execute a sell transaction once the red bar is locked in on the close.
Stop Loss
- Position the stop loss for buy trades below the most recent swing low.
- Place the stop loss for sell trades above the most recent swing high.
- Move the stop loss to break even once the trade moves into significant profit.
Take Profits
- Exit the position when the histogram bars switch to the opposite color.
- Use previous support or resistance zones as natural areas to book gains.
Force MACD Signal Scalping Strategy for MT5 with Momentum Timing
This scalping strategy combines the Force MACD Signal indicator for MT5 with the Momentum indicator for MT5.
It focuses on capturing quick bursts of momentum by aligning trend strength with precise entry timing.
The Force MACD Signal indicator identifies the dominant direction using histogram color, which reflects bullish or bearish momentum.
The Momentum indicator complements this by signaling when price acceleration shifts direction through its zero line crossover, a widely used method to confirm momentum changes.
This method is ideal for M1 and M5 charts during active sessions.
It is built for traders who want fast entries with confirmation rather than guessing market direction.
Buy Entry Rules
- Wait for the Force MACD histogram to turn green, confirming a bullish trend.
- Wait for the Momentum indicator to move from below 0 to above 0.
- Enter a buy trade at the close of the confirmation candle.
- Place the stop loss a few pips below the recent micro swing low.
- Take profit when either the histogram turns red, the Momentum indicator drops back below 0, or at the next short-term resistance level.
Sell Entry Rules
- Wait for the Force MACD histogram to turn red, confirming a bearish trend.
- Wait for the Momentum indicator to move from above 0 to below 0.
- Enter a sell trade at the close of the confirmation candle.
- Place the stop loss a few pips above the recent micro swing high.
- Take profit when either the histogram turns green, the Momentum indicator moves back above 0, or at the next short-term support level.
Case Study 1: EUR/JPY M1 Buy Scalping Trade
On the EUR/JPY M1 timeframe during the London session, the Force MACD histogram turned green, indicating bullish pressure.
At the same time, the Momentum indicator crossed above the zero line, confirming acceleration to the upside.
A buy trade was opened at candle close with a tight stop loss placed below the recent micro swing low.
Price reacted quickly and pushed higher in a short burst.
The trade was closed within minutes as momentum rapidly slowed, capturing a 12 pip gain.
Case Study 2: GBP/AUD M5 Sell Scalping Trade
On the GBP/AUD M5 timeframe during the New York session, the Force MACD histogram turned red, signaling bearish conditions.
The Momentum indicator crossed below the zero line, confirming downside acceleration.
A sell trade was executed at candle close with the stop loss placed above the recent micro swing high.
Price dropped quickly as selling pressure increased.
The trade was closed near a short-term support level, securing a 31 pip profit.
Download Now
tsd_pp_macd_force_ind_v1.mq5 Indicator (MT5)
FAQ
Can I adjust the sensitivity of the signals?
Yes, you can modify the fast and slow moving average inputs in the settings.
Reducing these values will make the indicator more responsive to price changes, while increasing them will provide smoother signals that lag slightly more but offer better trend confirmation.
What does the force value parameter do?
The force value determines how much weight is given to the volume component of the calculation.
A higher force value requires more significant market participation to change the color of the histogram, which can help in avoiding choppy market conditions.
Summary
The Force MACD Signal indicator is a robust solution for traders who need to identify trend direction without second-guessing their charts.
The green and red histogram bars serve as an intuitive map for entering and exiting trades at the right moments.
While it is highly effective on its own, combining it with basic support and resistance levels can further enhance its performance.
This tool is a valuable addition to any MT5 setup for those looking to capture medium to long-term price movements with confidence.


