
About the TRIX Cloud Indicator
The TRIX Cloud indicator for Metatrader 5 is a versatile tool designed to help traders identify early trend reversals across Forex markets.
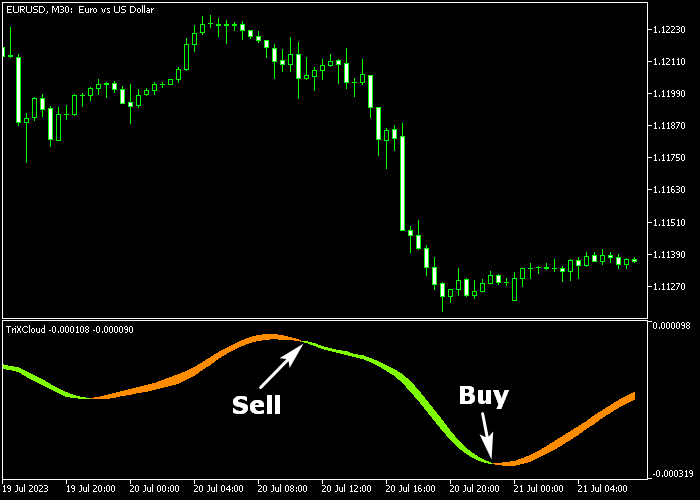
It uses a triple moving average calculation to form a cloud that alternates between green and orange, signaling potential bullish or bearish momentum.
The indicator provides easy-to-interpret trading signals directly on the chart.
A green cloud indicates upward momentum, suggesting a buying opportunity, while an orange cloud indicates downward momentum, signaling a potential sell.
Traders can customize the indicator period, cloud colors, and other parameters to suit their preferred trading style.
The indicator works on all trading instruments supported by MetaTrader 5, making it a flexible tool for any Forex strategy.
Free Download
Key Features
- TRIX cloud with alternating colors for trend identification.
- Customizable period, cloud up color, and cloud down color.
- Signals appear directly on the main price chart for easy interpretation.
Indicator Chart
The TRIX Cloud appears as a green or orange cloud in a separate chart window.
It shows bullish or bearish trend signals in real-time, helping traders quickly spot trade opportunities.
Guide to Trade with the TRIX Cloud Indicator
Buy Rules
- A buy signal is generated when the green cloud appears on the chart.
- Consider entering near support levels for higher probability trades.
- Maintain awareness of nearby resistance to manage potential reversals.
Sell Rules
- A sell signal is generated when the orange cloud appears on the chart.
- Consider entering near resistance levels for higher probability trades.
- Monitor nearby support zones to anticipate possible reversals.
Stop Loss
- For buy trades, place the stop loss a few pips below the nearest support level.
- For sell trades, place the stop loss a few pips above the nearest resistance level.
- Adjust stops according to recent swing highs or lows for added safety.
Take Profits
- For buy trades, target the next resistance level or a fixed risk-to-reward ratio.
- For sell trades, target the next support level or a fixed risk-to-reward ratio.
- Alternatively, exit when the cloud color reverses, signaling the opposite trend.
TRIX Cloud Momentum Strategy MT5 with Trend Bar Confirmation
This strategy combines the TRIX Cloud Forex indicator for MT5 with the Simple Trend Bar indicator with Signal for MT5.
It is built to capture clean trend continuation moves using both cloud-based momentum and visual trend strength.
The TRIX Cloud highlights the dominant direction with colored zones, making it easy to spot when bullish or bearish pressure is in control.
The Simple Trend Bar strengthens this by confirming whether the current move has solid backing.
This method performs strongly on M5 and M15 timeframes.
It suits traders who want to follow momentum instead of predicting reversals.
Buy Entry Rules
- Wait for the TRIX Cloud to turn green, signaling bullish momentum.
- Confirm that the Simple Trend Bar shows green, indicating a buy trend.
- Enter a buy trade at the close of the confirmation candle.
- Place the stop loss below the most recent consolidation area or below the cloud structure.
- Take profit at a fixed risk to reward ratio of 1:1.5 or when the trend bar changes to red color.
Sell Entry Rules
- Wait for the TRIX Cloud to turn orange, signaling bearish momentum.
- Confirm that the Simple Trend Bar shows red, indicating a sell trend.
- Enter a sell trade at the close of the confirmation candle.
- Place the stop loss above the recent price rejection zone.
- Take profit at the next key support level or when the trend bar changes to green color.
Case Study 1: EUR/USD M5 Buy Trend Trade
On the EUR/USD M5 timeframe, the TRIX Cloud turned green and price began to push higher.
The Simple Trend Bar also printed green, confirming bullish conditions.
A buy trade was opened at candle close after both signals aligned.
The stop loss was placed below a recent consolidation zone where price had paused before continuing higher.
Price moved steadily upward with strong momentum.
The position was closed at a predefined risk to reward target, resulting in a 25 pip gain.
Case Study 2: USD/JPY M15 Sell Trend Trade
On the USD/JPY M15 timeframe, the TRIX Cloud shifted to orange, signaling bearish momentum.
The Simple Trend Bar turned red, confirming the downward trend.
A sell trade was executed at candle close once both indicators aligned.
The stop loss was placed above a recent rejection zone where sellers had previously stepped in.
Price declined consistently as bearish pressure increased.
The short trade was closed near a support level, capturing a 37 pip profit.
Download Now
FAQ
How do I interpret the TRIX Cloud signals?
A green cloud signals potential bullish momentum, while an orange cloud signals bearish momentum.
Can I combine the TRIX Cloud with other indicators?
Many traders use support and resistance, moving averages, or oscillators alongside the TRIX Cloud to refine entries and exits.
What adjustments improve signal accuracy?
Customizing the TRIX period and cloud colors can help align signals with your trading style.
Monitoring nearby support and resistance also increases reliability.
Summary
The TRIX Cloud indicator provides an intuitive visual representation of trend changes using green and orange clouds.
It helps traders spot early reversals and potential trade opportunities across all instruments and time frames.
Customizable settings make it adaptable for scalping, day trading, or swing trading, while combining it with support and resistance levels can enhance precision.
Its non-repainting signals provide reliable guidance for traders seeking to improve entries and exits in volatile markets.


