
About the Volty Channel Stop Indicator
The Volty Channel Stop indicator for MT5 is a powerful tool that helps traders identify potential trend reversals and follow price momentum.
It displays a colored signal line directly on the price chart, switching between blue for buy signals and red for sell signals.
The indicator can also act as a trailing stop tool, helping protect profits in volatile markets.
Traders can customize multiple settings, including MA period, MA method, ATR period, volatility factor, alerts, and line colors.
This makes it adaptable for all currency pairs, any timeframe, and various trading styles.
Free Download
volty_channel_stop.mq5 Indicator (MT5)
Key Features
- Identifies trend reversals with buy and sell signals.
- Displays blue and red signal lines directly on the price chart.
- Can be used as a trailing stop tool.
- Customizable MA and ATR settings for flexibility.
- Alerts and notifications for timely trade decisions.
- Simple to use for both scalpers and day traders.
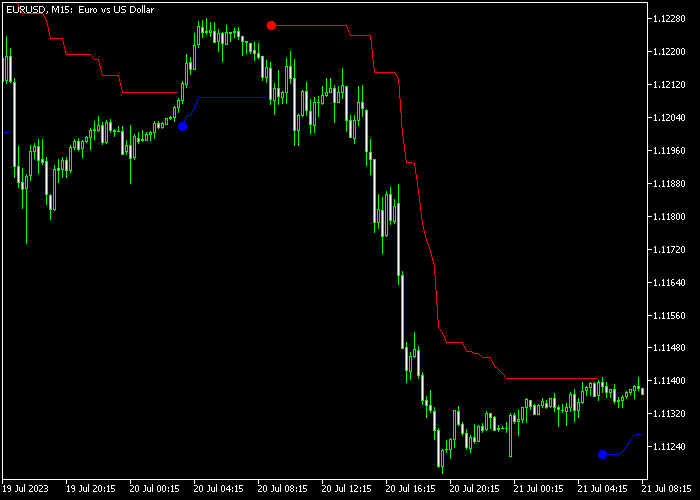
Indicator Chart
The Volty Channel Stop is plotted directly on the main price area.
The chart shows blue lines below candles signaling potential buys and red lines above candles signaling potential sells.
It visually highlights trend direction changes and possible entry points.
Guide to Trade with Volty Channel Stop
Buy Rules
- Enter a buy trade when the blue Volty Channel Stop line appears below the candlesticks.
- Use the indicator line to monitor momentum and timing for entries.
- Only enter trades when the price shows upward movement aligned with the blue line.
Sell Rules
- Enter a sell trade when the red Volty Channel Stop line appears above the candlesticks.
- Use the indicator line to monitor momentum and timing for entries.
- Only enter trades when the price shows downward movement aligned with the red line.
Stop Loss
- For buy trades, set a protective stop below the blue Volty line.
- For sell trades, set a protective stop above the red Volty line.
- Move stop to breakeven once the trade is in profit for additional safety.
Take Profits
- Close buy trades when the blue line flips to red or at a predetermined pip target.
- Close sell trades when the red line flips to blue or at a fixed take profit level.
- Partial profit-taking can be used when the price reaches the previous swing high or low.
- Adjust take profits based on market volatility and your risk-to-reward ratio.
Volty Channel Stop Power Scalping Strategy MT5 for London & New York Sessions
This high-probability scalping strategy combines the Volty Channel Stop indicator for MT5 with the Super Signals indicator for MT5.
It is designed to capture fast intraday moves during the most active trading hours.
The Volty Channel Stop provides a clear trend direction using dynamic channels based on volatility and moving averages, helping traders identify momentum and reversals in real time.
The Super Signals indicator adds precise entry timing through visual arrow signals based on momentum analysis.
This strategy works best during the London and New York sessions when volatility increases and price moves more decisively.
It is built for M1 and M5 charts and fits traders who prefer quick trades with structured confirmation.
Buy Entry Rules
- Wait for the Volty Channel Stop line to turn blue, confirming a bullish trend.
- Look for a blue arrow from the Super Signals indicator.
- Enter a buy trade at the close of the signal candle.
- Place the stop loss below the most recent swing low or below the blue channel line.
- Take profit when a magenta arrow appears or when the Volty Channel Stop turns red.
Sell Entry Rules
- Wait for the Volty Channel Stop line to turn red, confirming a bearish trend.
- Look for a magenta arrow from the Super Signals indicator.
- Enter a sell trade at the close of the signal candle.
- Place the stop loss above the most recent swing high or above the red channel line.
- Take profit when a blue arrow appears or when the Volty Channel Stop turns blue.
Case Study 1: EUR/USD M5 London Session Buy Trade
During the London session on EUR/USD M5, the Volty Channel Stop line turned blue and price started trending upward.
Shortly after, a blue arrow appeared from the Super Signals indicator, confirming a buy setup.
A buy trade was opened at candle close with the stop loss placed below the recent swing low.
Price moved strongly in the direction of the trend as volatility increased during the session.
The trade was closed when an opposite signal appeared, securing a 19 pip gain.
Case Study 2: GBP/USD M1 New York Session Sell Trade
During the New York session on GBP/USD M1, the Volty Channel Stop line turned red, confirming bearish conditions.
A magenta arrow appeared shortly after, signaling a sell opportunity.
A sell trade was executed at candle close with the stop loss placed above the recent swing high. Price accelerated downward as momentum increased.
The trade was closed when the trend began to weaken, capturing a 14 pip profit.
Download Now
volty_channel_stop.mq5 Indicator (MT5)
FAQ
How do I interpret the blue and red lines?
The blue line below the candles signals potential buy opportunities, while the red line above the candles signals potential sell opportunities.
The color change often indicates a trend reversal.
Can the indicator be used for trailing stops?
Yes. Traders can use the blue and red lines as dynamic stop levels, adjusting trades as the market moves to lock in profits.
Which markets is the Volty Channel Stop suitable for?
It works well on all Forex pairs and other instruments supported on MT5.
It performs best in trending or volatile markets where reversals occur.
Can I adjust the sensitivity of the signals?
Yes. Inputs like MA period, ATR period, and volatility factor can be customized to fine-tune the signals for more frequent or more conservative entries.
Summary
The Volty Channel Stop indicator identifies trend reversals with precision and highlights potential buy and sell opportunities directly on the price chart.
Its blue and red signal lines help traders follow market momentum and capture entry points effectively.
With customizable MA, ATR, and alert settings, it adapts to different trading styles and timeframes.
The indicator can also serve as a dynamic trailing stop, providing an additional layer of risk management while keeping trades aligned with prevailing market trends.


