About the Bollinger Bands Indicator
The Bollinger Bands Indicator for MT5 is a classic volatility tool that plots three dynamic bands around price.
It consists of a middle band, which is usually a moving average, and two outer bands that expand and contract based on market volatility.
When volatility increases, the bands widen. When volatility decreases, the bands move closer together.
This behavior allows traders to quickly gauge whether the market is active or moving in a tight range.
The indicator appears directly in the main price area and follows price movements in real time.
The middle band often acts as a dynamic support or resistance level, while the outer bands highlight potential overbought and oversold zones.
Traders often use Bollinger Bands to detect breakouts, trend continuation, and reversal opportunities.
The indicator works across multiple timeframes and can be applied to forex pairs, indices, commodities, and cryptocurrencies.
Free Download
Key Features
- Displays three dynamic bands that adjust automatically to market volatility.
- The middle band functions as a moving average trend reference.
- Outer bands highlight potential overbought and oversold price zones.
- Bands widen during high volatility and contract during quiet market conditions.
- Helps traders identify trend direction, breakouts, and reversal areas.
- Works on all timeframes and supports multiple trading styles.
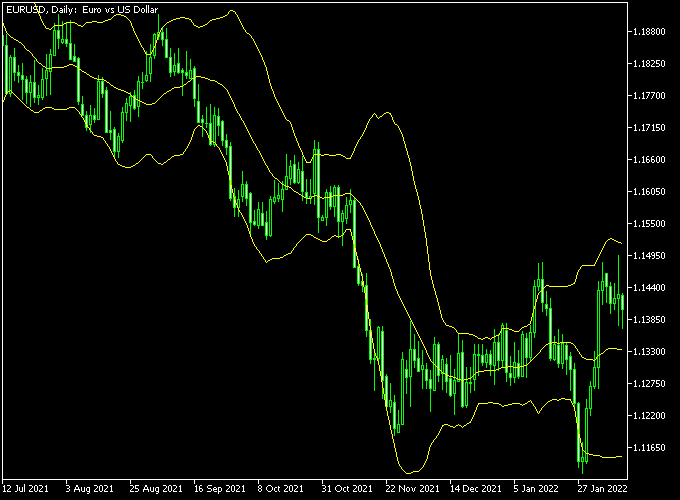
Indicator Chart
The Bollinger Bands Indicator appears directly beneath the main price movement and surrounds price with an upper band, middle band, and lower band.
The example chart below shows how price reacts to the bands during strong trends and range conditions, highlighting possible buy and sell areas when price touches or breaks the outer bands.

Guide to Trade with the Bollinger Bands Indicator
Buy Rules
- Wait for the price to touch or move below the lower Bollinger Band.
- Look for bullish price rejection near the lower band.
- Confirm that the bands begin turning upward.
- Enter a buy trade as price moves back toward the middle band.
Sell Rules
- Wait for the price to touch or move above the upper Bollinger Band.
- Look for bearish rejection near the upper band.
- Confirm that the bands start turning downward.
- Enter a sell trade as price begins moving back toward the middle band.
Stop Loss
- Place the stop loss a few pips below the lower Bollinger Band for buy trades.
- Place the stop loss a few pips above the upper Bollinger Band for sell trades.
- If price closes strongly outside the band against your position, consider exiting early.
Take Profit
- Close the buy trade when price reaches the upper Bollinger Band.
- Close the sell trade when price reaches the lower Bollinger Band.
- Exit the trade if the bands flatten and momentum fades.
Bollinger Bands MT5 + Zone Trade Histogram Scalper Strategy
This scalping strategy combines the Bollinger Bands indicator with the Zone Trade Histogram Scalper indicator to trade short-term movements on M1 and M5 charts.
The Bollinger Bands indicator is used to identify direction through the slope of the bands.
Upward sloping bands indicate bullish conditions while downward sloping bands indicate bearish conditions.
This sets the overall bias.
The Zone Trade Histogram Scalper indicator provides entry signals.
The first blue histogram bar signals a buy entry while the first orange histogram bar signals a sell entry.
These initial bars are used as the trigger.
Trades are taken only when the histogram signal aligns with the direction of the Bollinger Bands slope.
Buy Entry Rules
- Wait for the Bollinger Bands to slope upward.
- Enter a buy trade on the first blue histogram bar.
- Ensure price is moving along the upper or middle band.
- Place the stop loss below the recent support or below the middle band.
- Take profit between 8 to 20 pips or close the trade when an orange histogram bar appears.
Sell Entry Rules
- Wait for the Bollinger Bands to slope downward.
- Enter a sell trade on the first orange histogram bar.
- Ensure price is moving along the lower or middle band.
- Place the stop loss above the recent resistance or above the middle band.
- Take profit between 8 to 20 pips or close the trade when a blue histogram bar appears.
Case Study 1: EURUSD M1 Buy Trade
On EURUSD M1, the Bollinger Bands started sloping upward, indicating bullish conditions. Price stayed near the upper band.
The Zone Trade Histogram Scalper printed its first blue bar, confirming a buy setup.
A buy trade was opened after the signal. The stop loss was placed below a recent support level.
The trade followed the upward movement and was closed for an 11 pip gain.
Case Study 2: GBPUSD M5 Sell Trade
On GBPUSD M5, the Bollinger Bands sloped downward, indicating bearish conditions. Price moved along the lower band.
The Zone Trade Histogram Scalper printed its first orange bar, confirming a sell setup.
A sell trade was entered after the signal.
The stop loss was placed above a recent resistance level.
The trade was managed according to the rules and was closed for an 18 pip gain.
Download Now
FAQ
What do the Bollinger Bands represent?
Bollinger Bands measure market volatility. The outer bands expand when volatility increases and contract when the market becomes quiet.
This helps traders identify active and slow market phases.
What does it mean when the bands become very narrow?
When the bands tighten significantly, it often signals a volatility squeeze.
This condition frequently appears before a strong breakout move.
Is the middle band important for trading decisions?
Yes. The middle band, which is usually a moving average, often acts as a dynamic support or resistance level.
Many traders use it as a target or confirmation level during trades.
Summary
The Bollinger Bands Indicator remains one of the most widely used volatility tools in forex trading. I
t helps traders evaluate market conditions, identify potential reversals, and follow developing trends.
Because the bands automatically expand and contract with volatility, traders can quickly see when the market becomes active or slow.
This makes the indicator practical for both breakout and reversal strategies.
The indicator is simple to understand yet flexible enough for advanced analysis.
When combined with price action and support or resistance levels, Bollinger Bands can provide consistent insight into market behavior and trading opportunities.


