About the Float Pivot Indicator
The Float Pivot Indicator for MT4 is a dynamic pivot point tool that updates in real-time with each market tick.
It provides traders with accurate pivot levels, as well as support and resistance boundaries, for more precise trade management.
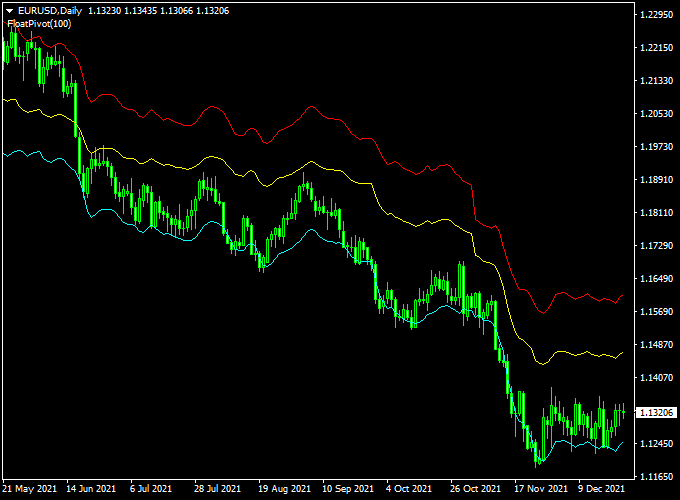
Displayed on the main MT4 chart, it features a central yellow pivot line with two additional boundaries acting as support and resistance zones.
This setup allows traders to identify potential entry and exit points quickly as price interacts with these key levels.
Float Pivot is suitable for all currency pairs and works on multiple timeframes, giving both beginners and experienced traders a reliable way to monitor market structure and adjust trades in real time.
Free Download
Download the “float-pivot-indicator.mq4” indicator for MT4
Key Features
- Real-time floating pivot points updated every tick
- Central pivot line with upper and lower support/resistance boundaries
- Helps identify entry and exit levels for trades
- Works on all currency pairs and multiple timeframes
- Compatible with other MT4 indicators for confirmation
- Clear visual display directly on the main chart
Indicator Chart
The chart shows the yellow pivot line as the central reference, with two boundaries representing dynamic support and resistance levels.
A price closing above the pivot suggests a potential buy opportunity, while closing below the pivot suggests a potential sell.
Traders can follow these levels for precise trade entries.

Guide to Trade with the Float Pivot Indicator
Buy Rules
- Open a buy trade when a candlestick closes above the yellow pivot line.
- Confirm trend direction using recent highs or moving averages for added accuracy.
- Optional: Check that the price is not immediately near the upper boundary to avoid entering overextended positions.
Sell Rules
- Open a sell trade when a candlestick closes below the yellow pivot line.
- Confirm the downward trend using recent lows or other trend indicators.
- Optional: Avoid entering near the lower boundary to reduce the risk of quick reversals.
Stop Loss Placement
- Buy trades: just below the nearest support boundary or minor swing low.
- Sell trades: just above the nearest resistance boundary or minor swing high.
- Alternatively, use a fixed pip distance or ATR-based stop for volatility-adaptive risk management.
Take Profit Targets
- Partial take profit at the first support/resistance boundary opposite to your trade direction.
- Final take profit near the second boundary or next major pivot level.
- Trailing stops can capture extended moves if the trend continues beyond the boundaries.
Practical Trading Tips
- Combine Float Pivot with trend indicators or oscillators to filter false breakouts.
- Monitor high-volume sessions for stronger pivot reactions.
- Use the pivot and boundaries as guides, not absolute entry/exit rules.
- Adjust chart colors and line thickness for clearer visualization.
MT4 Day Trading Strategy: Float Pivot + Mega FX Profit
This strategy pairs the Float Pivot Indicator with the Mega FX Profit Indicator to obtain trend context plus precise entry signals.
The Float Pivot shows a pivot line (yellow) and a pivot channel.
When the price is above the yellow pivot, and the pivot channel slopes upward, that’s a bullish context.
Conversely, when the price is below the pivot and the channel slopes downward, that suggests bearish.
The Mega FX Profit adds confirmation by plotting arrows (green arrow = bullish, red arrow = bearish) in a separate subchart.
Use this as an intraday or day trading method on timeframes like M15 or M30 during the London and New York sessions.
Buy Entry Rules
- Price must be above the yellow pivot point line on the Float Pivot, and the pivot point channel must slope upward (bullish structure).
- Mega FX Profit must display a green arrow (bullish signal) in its subchart.
- Enter a buy order at the close of the candle where the green arrow appears (provided price remains above the pivot and channel holds bullish).
- Set stop loss a few pips below the recent swing low or below the pivot line if appropriate.
- Set take profit at a reasonable intraday target (e.g., next resistance, Fibonacci extension, or 1.5:1 to 2:1 risk-reward ratio, whichever comes first).
Sell Entry Rules
- Price must be below the yellow pivot point line on the Float Pivot, and the pivot channel must slope downward (bearish structure).
- Mega FX Profit must show a red arrow (bearish signal) in its subchart.
- Enter a sell order at the close of the candle that prints the red arrow (if the price remains below the pivot and the pivot channel is downward).
- Place a stop loss a few pips above the recent swing high or above the pivot line (if that acts as resistance).
- Set take profit at intraday support, or at a target consistent with 1.5:1 or 2:1 risk-reward or other technical level.
Advantages
- Combines structure (pivot and channel) with a signal filter (arrow) to reduce false entries.
- Clear visual cues make it easier to see where trend context is honored.
- Works on intraday timeframes and can adapt to momentum shifts within the day.
- You can adjust profit target strategies (fixed R:R, pivot levels, price zones) rather than rigid pips.
Drawbacks
- Pivot channel slope may lag in fast reversals, so signals might appear late.
- In choppy or range markets, the price can cross the pivot often, leading to more false signals.
- You might miss parts of a move if waiting for the perfect alignment of both indicators.
Case Study 1: AUD/USD on 30-Minute Chart
During the London–New York overlap, the Float Pivot indicator showed price drifting above the yellow pivot line, and the pivot channel started sloping upward.
Then the Mega FX Profit indicator printed a green arrow.
A buy trade was entered at 0.6712 at candle close.
The swing low was at 0.6700, so the stop loss was placed at 0.6698 (14 pips risk).
To take profit, a resistance zone was nearby at 0.6735, giving a potential gain of 23 pips (about a 1.6:1 reward to risk).
The market moved in that direction and hit the zone within that session, netting 23 pips.
Case Study 2: USD/CAD on 15-Minute Chart
Later in the day, Float Pivot showed a price below the yellow pivot line, and the pivot channel was trending downward.
Mega FX Profit printed a red arrow, confirming bearish pressure.
A sell order was executed at 1.3475 at candle close.
The swing high was 1.3488, so the stop loss was placed at 1.3490 (15 pips risk).
A support zone was located around 1.3452, so the take profit was set there for 23 pips potential (≈1.5:1).
Price moved down and hit that support zone, giving 23 pips profit.
Strategy Tips
- Prefer major currency pairs (EUR/USD, GBP/USD, AUD/USD, USD/CAD, etc.) with good liquidity to reduce spreads and slippage.
- Check a higher timeframe (e.g., H1) pivot direction or trend to avoid fighting a dominant longer-term trend.
- Avoid entering just before major economic news or during news windows—price can spike and flip pivot context quickly.
- Consider scaling out partial profits if price moves strongly, and trail your stop to lock gains.
- Backtest this strategy on the specific pairs and sessions you like to trade, to fine-tune indicator settings or risk
Download Now
Download the “float-pivot-indicator.mq4” indicator for Metatrader 4
FAQ
How often does the Float Pivot update?
The pivot points recalculate with every new tick, providing real-time levels that reflect the latest market activity.
Can I trade directly from the pivot levels?
Yes, but it’s best to confirm entries with price action, candlestick patterns, or other indicators to improve accuracy.
Do the support and resistance boundaries change automatically?
Yes. The upper and lower boundaries adjust in real time based on price movement, helping traders anticipate potential reversals.
Is it suitable for intraday and swing trading?
Absolutely. The indicator works on any timeframe, allowing traders to use it for short-term scalps or longer-term trend strategies.
Summary
The Float Pivot Indicator for MT4 is a dynamic tool that provides real-time pivot points with adjustable support and resistance boundaries.
Traders can use these levels to identify potential trade entries, exits, and areas of market reaction.
Its floating design ensures that pivot values stay current with market activity, offering an edge in both intraday and swing trading.
While it doesn’t issue automatic buy or sell signals, it complements other technical tools, helping traders make more informed decisions and manage risk effectively.


