
About the All Fibonacci Fibos Levels Indicator
The All Fibonacci Fibos Levels Indicator for MT5 helps traders pinpoint high-probability retracement zones inside trending markets.
It automatically plots the most respected Fibonacci retracement levels directly on the price chart, including 0.236, 0.382, 0.5, 0.618, 0.764, and 0.886.
The core trading focus is the 0.382 retracement level.
In strong trends, price often pulls back to this level before continuing in the original direction.
This makes it a practical area to buy dips in uptrends or sell rallies in downtrends.
The indicator allows full customization.
Traders can adjust the Fibonacci levels, switch between high-to-low calculations, and define how many bars back the tool should analyze.
Free Download
Key Features
- Automatically plots major Fibonacci retracement levels on the chart.
- Highlights 0.382 retracement for pullback trading opportunities.
- Customizable Fibonacci levels and calculation settings.
- Helps identify trend continuation entries.
- Simple layout integrated directly into the price area.
Indicator Chart
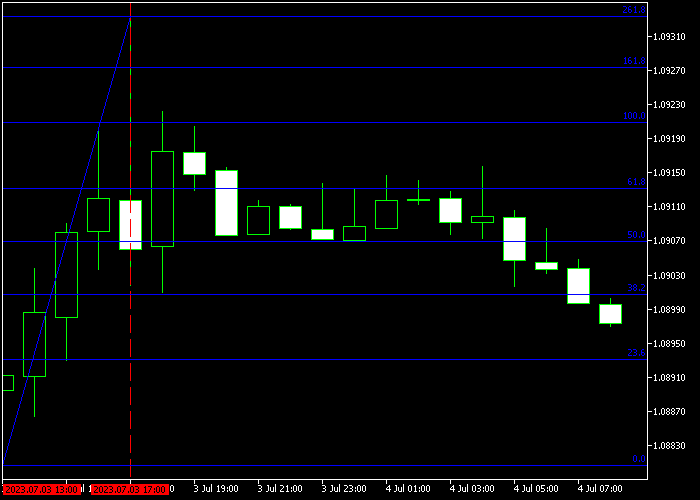
The All Fibonacci Fibos Levels Indicator displays multiple retracement levels directly over price action.
In an uptrend, traders watch for the price pulling back to 0.382 before continuing higher.
In a downtrend, rallies into 0.382 often provide short opportunities.
The chart clearly shows how price reacts around these levels, allowing traders to time entries with precision.
Guide to Trade with All Fibonacci Fibos Levels Indicator
Buy Rules
- Confirm that the market is in a strong and sustained uptrend.
- Wait for price to retrace back toward the 0.382 Fibonacci level.
- Look for bullish price action confirmation at the retracement zone.
- Enter a buy trade as the market resumes upward momentum.
Sell Rules
- Confirm that the market is in a strong and sustained downtrend.
- Wait for price to rally back toward the 0.382 Fibonacci level.
- Look for bearish price action confirmation at the retracement zone.
- Enter a sell trade as the market resumes downward momentum.
Stop Loss
- For buy trades, place the stop loss below the next deeper Fibonacci ratio, such as 0.5 or 0.618.
- For sell trades, place the stop loss above the next deeper Fibonacci rati,o such as 0.5 or 0.618.
Take Profit
- For buy trades, consider recent highs as logical profit zones.
- For sell trades, consider recent lows as logical profit zones.
- Optionally trail profits as the trend extends.
All Fibonacci Levels RSI Bollinger Strategy for MT5
This strategy uses dynamic retracement entries with trend confirmation to capture structured swing moves on M15 and H1 charts.
It combines the All Fibonacci Fibos Levels Indicator with the RSI Bollinger Bands Indicator.
The goal is to enter after retracements toward a key Fibonacci level while respecting the prevailing trend.
The All Fibonacci Fibos Levels Indicator automatically plots universal Fibonacci retracement zones.
In an uptrend, price often pulls back toward the 0.382 level before resuming higher.
In a downtrend, rallies typically revert to the 0.382 level before turning lower again.
These retracements create favorable entry points with defined risk.
The RSI Bollinger Bands Indicator adds trend direction and entry timing.
A green arrow signals bullish momentum and trend bias, while a red arrow highlights bearish momentum.
This helps avoid counter‑trend entries that lack strength.
Buy Entry Rules
- Identify an uptrend confirmed by higher highs and higher lows.
- Wait for price to retrace toward the 0.382 Fibonacci level.
- Confirm a green arrow from the RSI Bollinger Bands Indicator.
- Enter a buy trade at the close of the confirmation candle near the 0.382 zone.
- Place the stop loss below the recent swing low.
- Close the trade when a red arrow appears or when price reaches the next Fibonacci extension or swing high.
- Alternatively, exit using a 1:2 risk‑to‑reward target.
Sell Entry Rules
- Identify a downtrend with a series of lower highs and lower lows.
- Wait for price to rally toward the 0.382 Fibonacci level.
- Confirm a red arrow from the RSI Bollinger Bands Indicator.
- Enter a sell trade at the close of the signal candle near the 0.382 zone.
- Place the stop loss above the recent swing high.
- Close the trade when a green arrow appears or when price reaches the next lower Fibonacci extension.
- You can also apply a 1:2 risk‑to‑reward exit.
Case Study 1: GBPUSD H1 Buy Setup
On GBPUSD H1 during a prolonged uptrend, price pulled back into the 0.382 Fibonacci retracement level after a strong rally.
The RSI Bollinger Bands Indicator produced a green arrow as price hovered near this zone.
A buy trade was entered at the close of the confirmation candle with the stop loss set beneath the recent swing low.
Price resumed its upward climb as buyers regained control.
The move continued toward the next Fibonacci extension and a prior high.
A red arrow later formed as momentum weakened, marking the logical point to secure profits and exit the position.
Case Study 2: AUDJPY H1 Sell Setup
On AUDJPY H1 during a consistent downtrend, price rallied toward the 0.382 Fibonacci retracement after a series of bearish waves.
The RSI Bollinger Bands Indicator gave a red arrow at that level, signaling bearish continuation pressure.
A sell trade was opened at the close of the signal candle. The stop loss was placed above the recent swing high.
Price then dropped sharply as sellers reasserted control.
Price continued lower and interacted with the next Fibonacci extension.
A green arrow appeared later, indicating a slowdown in bearish momentum and suggesting it was time to take profit on the position.
Download Now
FAQ
Why is the 0.382 Fibonacci level important?
The 0.382 level often acts as a shallow retracement zone in strong trends.
It allows traders to join momentum early without waiting for deeper pullbacks.
Can I modify the Fibonacci levels?
Yes. You can customize all plotted Fibonacci levels and adjust the calculation method according to your trading preference.
Does the indicator work on lower timeframes?
Yes. It works on all timeframes.
Lower timeframes provide more frequent setups, while higher timeframes deliver stronger trend-based opportunities.
Can this indicator be used outside Forex?
Yes. It works equally well on Gold, Indices, Stocks, and other MT5 instruments.
Summary
The All Fibonacci Fibos Levels Indicator helps traders trade pullbacks with precision inside trending markets.
Focusing on the 0.382 retracement level provides disciplined entry points aligned with momentum.
Its flexibility, multi-market compatibility, and customizable settings make it suitable for both short-term and swing traders.
When combined with proper trend analysis and risk management, it becomes a powerful continuation trading tool.


