About the AMA with Noise Filter Indicator
The AMA with Noise Filter indicator for MT5 is a trend-following tool that combines an Adaptive Moving Average with a market noise filter.
It helps traders anticipate currency trends while reducing false signals from market fluctuations.
The indicator plots a purple line on the price chart.
Candles above the line indicate bullish conditions, while candles below suggest bearish conditions.
Its built-in noise filter improves signal reliability, making it suitable for both beginners and experienced traders.
The AMA with Noise Filter indicator allows customization of fast and slow MA periods, range, noise filter level, and threshold.
It can be used alone or combined with other indicators for confirmation and more precise trade setups.
Free Download
Key Features
- Adaptive Moving Average with noise reduction for more accurate trend signals.
- Clear visual trend identification via a purple signal line.
- Customizable inputs: fast MA, slow MA, range, noise filter, and level.
- Suitable for multiple trading styles and timeframes.
- Can be combined with other indicators or used independently.
- Reduces false signals in choppy market conditions.
Indicator Chart
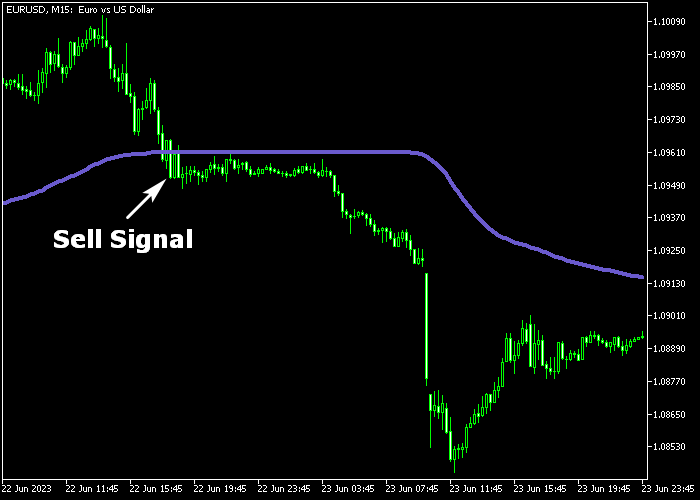
The AMA with Noise Filter indicator appears as a purple line on the main price chart.
Buy trends are confirmed when candles are above the line, and sell trends are confirmed when candles are below.
Traders can visually track trend changes and potential entry points.
Guide to Trade with AMA with Noise Filter Indicator
Buy Rules
- Check that the overall trend aligns with bullish market conditions.
- Wait for the candle to cross the purple AMA line from below.
- Enter a buy trade as the candle closes above the AMA line.
- Optional: confirm trend with a secondary indicator or support level.
Sell Rules
- Ensure the overall market trend aligns with bearish conditions.
- Wait for the candle to cross the purple AMA line from above.
- Enter a sell trade as the candle closes below the AMA line.
- Optional: confirm trend with a secondary indicator or resistance level.
Stop Loss
- Place a stop loss just below the recent swing low for buy trades.
- Place a stop loss just above the recent swing high for sell trades.
- Consider trailing stops to protect profits during strong trends.
Take Profit
- Close buy trades when the candle crosses back below the purple AMA line.
- Close sell trades when the candle crosses back above the purple AMA line.
- Optionally, trail stops along the AMA line to capture extended trend moves.
AMA with Noise Filter MT5 Strategy Using RSI Swings Indicator
This strategy combines the AMA with Noise Filter indicator and the RSI Swings indicator to create a clean and responsive trading approach.
It focuses on filtering market noise while confirming momentum shifts through RSI-based swing signals.
The AMA with Noise Filter provides a smooth trend direction using its adaptive moving average.
It reacts to price changes while avoiding false signals in choppy conditions.
The RSI Swings indicator adds confirmation by highlighting bullish and bearish momentum through histogram changes.
This strategy works best on lower timeframes such as M5 and M15.
It suits scalpers and intraday traders who want clear entry signals without overcomplication.
The combination helps traders avoid weak setups and focus only on high-probability moves.
Buy Entry Rules
- Wait for price to close above the purple AMA line.
- Confirm that the RSI Swings histogram prints a green bar.
- Enter a buy trade at the opening of the next candle.
- Place stop loss below the most recent swing low.
- Take profit when the histogram turns red or when price shows rejection near resistance.
Sell Entry Rules
- Wait for price to close below the purple AMA line.
- Confirm that the RSI Swings histogram prints a red bar.
- Enter a sell trade at the opening of the next candle.
- Place stop loss above the most recent swing high.
- Take profit when the histogram turns green or when price reacts near support.
Case Study 1: AMA Trend Confirmation
On EURUSD M5, price moved sideways before breaking upward with strong momentum.
A candle closed clearly above the purple AMA line which indicated a bullish shift.
Shortly after, the RSI Swings histogram printed a green bar which confirmed buying pressure.
A buy trade was opened at the next candle. The stop loss was placed below the recent consolidation low.
Price continued trending upward with minimal pullbacks.
The trade was closed when the histogram started weakening and showed early signs of reversal.
Case Study 2: RSI Swings Scalping Signal
On GBPJPY M5, the market showed short bursts of volatility which created ideal scalping conditions.
The RSI Swings histogram printed a red bar after a brief upward move which signaled bearish momentum.
At the same time, price stayed below the AMA line which confirmed the trend direction.
A sell trade was entered immediately after the signal candle closed.
The stop loss was placed above the recent high. Price quickly dropped in the next few candles.
The trade was closed as soon as a green histogram bar appeared, locking in a fast scalp profit.
Download Now
FAQ
What is the benefit of the noise filter in AMA?
The noise filter reduces the number of false signals in volatile or sideways markets, making trend signals more reliable.
Can I use this indicator alone?
Yes, the AMA with Noise Filter can act as a standalone trend indicator. For higher accuracy, combine it with support/resistance or momentum tools.
Which timeframes are best for AMA with Noise Filter?
It works on any timeframe. Shorter timeframes (M1-M15) suit intraday trading, while higher timeframes help confirm swing trends.
Summary
The AMA with Noise Filter indicator combines adaptive moving averages with a built-in noise filter to deliver reliable trend signals.
Candles above the purple line indicate bullish momentum, while candles below indicate bearish pressure.
This tool can be used alone or with other technical indicators to confirm trend direction.
Its adjustable settings and signal clarity make it effective for traders of all experience levels, helping them reduce false signals and improve timing for entries and exits.