
About the Aroon Oscillator MTF Indicator
The Aroon Oscillator MTF Indicator for MT5 measures trend strength and generates clear buy and sell signals across multiple timeframes.
MTF stands for multiple time frame analysis, which allows traders to check trend alignment before entering trades.
The indicator appears in a separate chart window as colored zones: blue zones indicate bullish conditions, and brown zones indicate bearish conditions.
This technical tool is particularly effective for scalping on low-spread forex pairs during volatile trading sessions.
Traders can combine its signals with support/resistance levels or other trend-following tools to improve trade accuracy.
Inputs include time frame, calculation period, high and low price selection, levels, interpolation, and display style.
These options make the indicator flexible and adaptable to different strategies.
Free Download
Aroon oscillator (mtf).mq5 Indicator (MT5)
Key Features
- Shows trend strength and generates buy/sell zones on a separate chart.
- Blue zones indicate bullish signals, brown zones indicate bearish signals.
- Supports multiple time frame analysis for better trade alignment.
- Works best on low-spread currency pairs during volatile sessions.
- Customizable time frame, calculation period, and levels.
- Adjustable high/low price selection and interpolation settings.
Indicator Chart
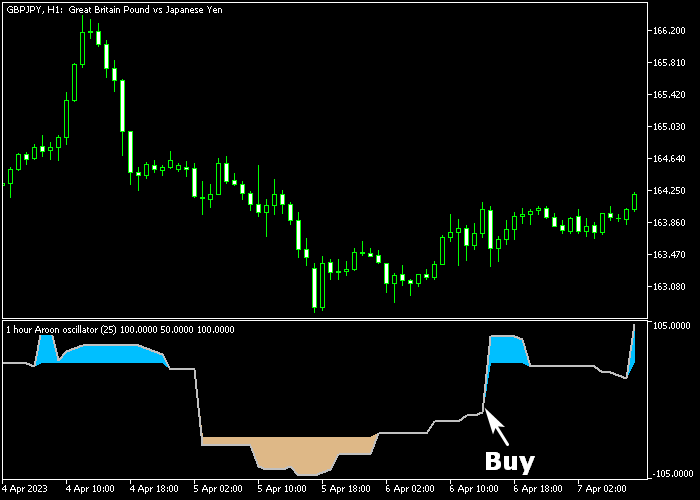
The Aroon Oscillator MTF Indicator displays blue and brown zones in a separate chart window.
Blue zones highlight bullish conditions and potential buy signals, while brown zones highlight bearish conditions and potential sell signals.
Traders can track trend strength and make quick decisions based on these colored zones.
Guide to Trade with Aroon Oscillator MTF Indicator
Buy Rules
- Wait for a blue Aroon zone to appear on the separate chart.
- Interpret the blue zone as a bullish signal.
- Open a buy order when the blue zone confirms.
Sell Rules
- Wait for a brown Aroon zone to appear on the separate chart.
- Interpret the brown zone as a bearish signal.
- Open a sell order when the brown zone confirms.
Stop Loss
- For buy trades, place the stop loss a few pips below the low of the breakout candle.
- For sell trades, place the stop loss a few pips above the high of the breakout candle.
Take Profit
- Set fixed take profit levels (e.g., 10-25 pips) according to your strategy and timeframe.
- Close buy trades when a brown zone appears or when your target is reached.
- Close sell trades when a blue zone appears or when your target is reached.
Aroon Oscillator MTF MT5 + Hull Moving Average Day Trading Strategy
This strategy combines the Aroon Oscillator MTF indicator with the Hull Moving Average indicator to create a clear and disciplined day trading approach.
The Aroon Oscillator highlights trend strength and direction through colored zones, making it easy to identify bullish and bearish phases.
A blue zone signals buying pressure, while a brown zone indicates selling pressure.
The Hull Moving Average complements this by smoothing price action and reacting quickly to trend changes.
A green Hull line confirms bullish conditions, while a red line confirms bearish momentum.
Together, these indicators help traders stay aligned with the dominant intraday trend.
This strategy is suitable for M5 and M15 charts and works well on major currency pairs during active trading sessions.
It focuses on following momentum rather than predicting reversals.
Buy Entry Rules
- Wait for the Aroon Oscillator to display a blue zone indicating bullish conditions.
- Confirm that the Hull Moving Average line is green.
- Enter a buy trade at the opening of the next candle after both conditions align.
- Place a stop loss below the most recent intraday support level.
- Close the trade when the Hull Moving Average turns red or when the Aroon zone changes to brown.
Sell Entry Rules
- Wait for the Aroon Oscillator to display a brown zone indicating bearish conditions.
- Confirm that the Hull Moving Average line is red.
- Enter a sell trade at the opening of the next candle after both conditions align.
- Place the stop loss above the most recent intraday resistance level.
- Close the trade when the Hull Moving Average turns green or when the Aroon zone changes to blue.
Case Study 1
On the EURUSD M15 timeframe, the Aroon Oscillator shifted into a blue zone, indicating a developing bullish trend.
At the same time, the Hull Moving Average turned green and started sloping upward.
A buy trade was entered at the next candle open. Price continued moving higher with steady momentum.
The trade remained open as long as both indicators stayed aligned.
Once the Hull line turned red, signaling weakening momentum, the long position was exited.
Case Study 2
On the GBPUSD M5 timeframe, the Aroon Oscillator entered a blue zone while the Hull Moving Average turned green.
The first bullish candle after alignment provided the entry signal for a buy trade.
Price moved upward in a clean intraday trend. The position was held as long as the Hull line remained green.
Once the Aroon Oscillator shifted out of the blue zone, the trade was closed to protect gains.
Download Now
Aroon oscillator (mtf).mq5 Indicator (MT5)
FAQ
What do the colored zones mean?
Blue zones indicate bullish momentum and potential buy signals, while brown zones indicate bearish momentum and potential sell signals.
Can the indicator settings be adjusted?
Yes, you can customize the time frame, calculation period, high/low price selection, levels, and display style to match your strategy and trading timeframe.
Is this indicator suitable for beginners?
Yes, the clear visual zones make it easy for beginners to identify bullish and bearish trends without complex analysis.
Summary
The Aroon Oscillator MTF Indicator simplifies trend trading by showing blue and brown zones for bullish and bearish momentum.
Traders can easily identify entry points and follow trends using this visual tool.
Stop loss and take profit levels are managed independently, allowing trades to be protected while aiming for clear profit targets.
The indicator is flexible, suitable for scalping, intraday, and swing trading strategies.
Customizable settings and multiple time frame support make this indicator a practical choice for traders looking to gauge trend strength and capture trade opportunities efficiently.


