
About the Bulls and Bears Indicator
The Bulls and Bears indicator for MT5 uses a green and brown histogram to measure market momentum.
Green bars above the zero line indicate bullish momentum, signaling potential buy trades, while brown bars below zero indicate bearish momentum, signaling potential sell trades.
This visual representation helps traders quickly assess the balance between buyers and sellers in the market.
The indicator is fully customizable, allowing users to adjust the period, histogram colors, and display style.
Scalpers on M1 and M5 charts benefit most from applying the indicator to low-spread Forex pairs.
By monitoring momentum shifts with the histogram, traders can time entries and exits more effectively and make informed trading decisions.
Free Download
Bulls and bears.mq5 Indicator (MT5)
Key Features
- Green and brown histogram shows bullish and bearish momentum.
- Signals appear above or below zero for buy and sell trades.
- Adjustable period and histogram colors for personalized setup.
- Ideal for scalping and short-term trend trading.
- Quickly identifies momentum shifts to guide entries and exits.
Indicator Chart
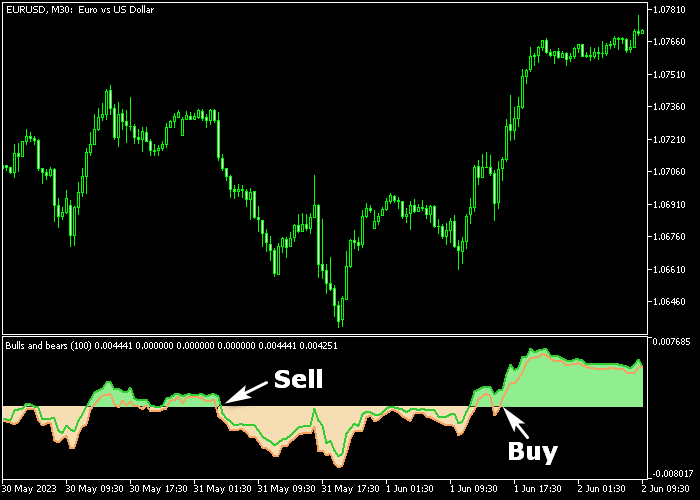
The Bulls and Bears indicator appears below the main price area as a green and brown histogram.
Green bars above zero signal bullish momentum and potential buy opportunities.
Brown bars below zero signal bearish momentum and potential sell opportunities.
The histogram clearly shows when market momentum is shifting.
Guide to Trade with Bulls and Bears Indicator
Buy Rules
- Wait for the green histogram to appear above the zero line.
- Confirm bullish momentum is building.
- Open a buy trade when momentum strengthens.
Sell Rules
- Wait for the brown histogram to appear below the zero line.
- Confirm bearish momentum is increasing.
- Open a sell trade when momentum strengthens.
Stop Loss
- Set the stop loss below support for buy trades and above resistance for sell trades.
- Adjust for volatility on lower timeframes.
Take Profit
- Close trades when the histogram reverses or changes color.
- Optional: target nearby support or resistance levels.
- Follow momentum to avoid exiting trades prematurely.
Download Now
Bulls and bears.mq5 Indicator (MT5)
FAQ
How do I know when to buy or sell?
Green histogram bars above zero indicate a buy signal, while brown bars below zero indicate a sell signal. Trade in the direction of the histogram.
Can this indicator be used on any timeframe?
Yes, it works on all timeframes. M1 and M5 are best for scalping, while higher timeframes capture broader trends.
Which settings affect signal responsiveness?
The histogram period determines sensitivity. Shorter periods create faster signals, while longer periods smooth out market noise.
Is it safe to use alone or with other tools?
It can be used alone for momentum-based trades, but combining with support/resistance or trend indicators improves reliability.
Summary
The Bulls and Bears indicator provides a straightforward way to track market momentum using a green and brown histogram.
Traders can quickly spot buy and sell opportunities based on the histogram’s position relative to zero.
The indicator is highly customizable and suitable for all instruments and timeframes.
Its simplicity and clear visual signals make it ideal for scalping and short-term trading, helping traders align with momentum and make timely decisions.


