
About the Asymmetric Bands Indicator
The Asymmetric Bands indicator for MT5 analyzes market conditions and highlights potential buy and sell opportunities using dynamic bands.
The indicator displays upper and lower bands with a middle gray dotted line to guide entries.
Wide bands reflect higher volatility, while narrower bands suggest calmer market periods.
Traders can quickly assess whether the market is trending up or down by observing the slope of the bands.
The indicator is fully customizable, allowing adjustment of the bands period, applied price, average method, and deviation.
By combining bandwidth, slope, and position relative to the middle line, traders can identify trend direction and timing for entering trades.
It is especially useful for traders seeking momentum-based entries and exits.
Free Download
Asymmetric bands.mq5 Indicator (MT5)
Key Features
- Upper and lower bands measure market volatility and trend direction.
- Middle gray line identifies potential buy and sell entry points.
- Customizable settings for period, price, deviation, and average method.
- Indicators’ slope signals the overall market trend.
- Helps traders time entries and exits with market momentum.
Indicator Chart
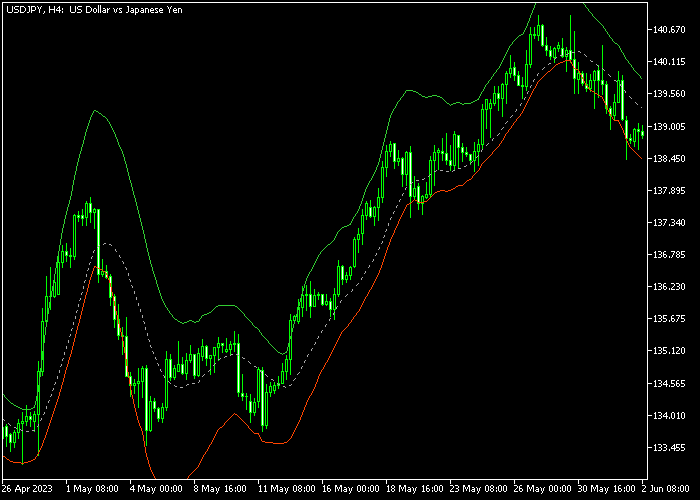
The Asymmetric Bands indicator appears on the main price area as a set of colored bands with a middle gray line.
The band’s slope indicates trend direction: an upward slope signals bullish conditions, a downward slope signals bearish conditions.
The chart highlights where candles interact with the middle line, providing clear entry opportunities for both long and short trades.
Guide to Trade with the Asymmetric Bands Indicator
Buy Rules
- Check that the bands are sloping upward.
- Look for the candle to touch the middle gray line from above.
- Open a buy trade once upward momentum confirms.
- Follow the candle movement toward the upper green band.
Sell Rules
- Check that the bands are sloping downward.
- Look for the candle to touch the middle gray line from below.
- Open a sell trade once bearish momentum confirms.
- Follow the candle movement toward the lower red band.
Stop Loss
- For buy trades, place a stop loss just below the lower red band.
- For sell trades, place a stop loss just above the upper green band.
- Adjust stops based on recent swing highs or lows for safety.
Take Profit
- Close buy trades near the upper green band or if the candle closes below the middle line.
- Close sell trades near the lower red band or if the candle closes above the middle line.
- Partial exits can be taken to secure profits during strong trends.
- Follow the band slope and momentum to avoid exiting too early.
Asymmetric Bands MT5 Trend Strategy with Force MACD Signal Confirmation
This strategy combines the Asymmetric Bands Indicator with the Force MACD Signal Indicator to build a clean trend-following approach for day trading.
The Asymmetric Bands indicator defines the market structure through band direction.
When the bands are rising, it indicates bullish trend conditions. When the bands are falling, it signals bearish pressure.
This makes it easy to stay aligned with the dominant market direction instead of trading against momentum.
The Force MACD Signal indicator works as a buy/sell confirmation tool.
A green histogram shows bullish momentum, while a red histogram shows bearish momentum.
This strategy works well on M15 and H1 charts.
It is designed for traders who prefer structured trend continuation entries rather than counter-trend scalping.
Buy Entry Rules
- Confirm that the Asymmetric Bands are rising, showing a bullish trend structure.
- Wait for the Force MACD histogram to turn green.
- Enter a buy trade at the close of the confirmation candle.
- Place the stop loss below the most recent swing low or under the lower asymmetric band.
- Adjust the stop loss as price moves upward, keeping it below recent swing structure or band support.
- Exit the trade when the Force MACD turns red or when the bands begin to flatten.
Sell Entry Rules
- Confirm that the Asymmetric Bands are falling, showing a bearish trend structure.
- Wait for the Force MACD histogram to turn red.
- Enter a sell trade at the close of the confirmation candle.
- Place the stop loss above the most recent swing high or above the upper asymmetric band.
- Adjust the stop loss as price moves downward, keeping it above recent swing structure or band resistance.
- Exit the trade when the Force MACD turns green or when the bands start flattening.
Case Study 1: Buy Trade Example (EUR/USD M15)
The Asymmetric Bands were clearly rising, showing a strong bullish trend phase.
After a small pullback into the mid area of the structure, the Force MACD histogram turned green, confirming renewed buying momentum.
A buy trade was opened at the candle close.
The stop loss was initially placed below the recent swing low and then trailed upward beneath the rising structure as price progressed.
The trade was closed when the Force MACD histogram shifted from green to red and price began to lose momentum near a flat section of the bands.
Case Study 2: Sell Trade Example (GBP/JPY H1)
The Asymmetric Bands were sloping downward, confirming a bearish trend environment.
After a brief retracement upward, the Force MACD histogram turned red, signaling renewed selling pressure.
A sell trade was opened at the candle close with the stop loss placed above the recent swing high.
The stop loss was trailed above the falling structure as price continued downward.
The trade was closed when the Force MACD flipped to green and the bands began to lose downward slope, showing that the bearish trend phase was ending.
Download Now
Asymmetric bands.mq5 Indicator (MT5)
FAQ
How do the Asymmetric Bands indicate market trends?
The slope of the bands determines the trend.
Upward-sloping bands show bullish conditions, downward-sloping bands show bearish conditions. The middle line helps time entries.
What does the width of the bands signify?
Wide bands indicate high volatility with stronger price movements, while narrow bands suggest low volatility and calmer market periods.
Can I adjust the indicator settings?
Yes, you can change the period, applied price, deviation, and averaging method.
Adjusting these settings helps make the indicator more responsive or smoother for different trading styles.
Is this indicator suitable for all timeframes?
Yes, it works on any timeframe from scalping charts to daily charts.
Traders can apply it to Forex, commodities, indices, and crypto instruments in MT5.
Summary
The Asymmetric Bands indicator is a versatile tool for tracking trends and market volatility.
Its colored bands and middle gray line make spotting buy and sell opportunities intuitive and responsive.
Customizable settings allow traders to adapt the indicator to their preferred instruments and timeframes.
By monitoring the slope of the bands and candle interactions, traders can align their entries with market momentum, improving timing and trade quality.
The indicator is suitable for both short-term and long-term trading strategies.


