
About the CCI Breakout Histogram Indicator
The CCI Breakout Histogram Indicator for MT5 is a standalone tool that identifies precise entry points for both trending and sideways markets.
It uses colored bars to signal potential buy and sell opportunities directly on the main price area.
Blue bars indicate bullish momentum, while pink bars indicate bearish momentum.
This indicator works across all timeframes and is ideal for scalpers and day traders who want to capitalize on short-term price movements.
Users can customize inputs such as the CCI period, extreme levels, bar colors, and more to match their preferred trading strategy.
Free Download
cci-histogram-round.mq5 Indicator (MT5)
Key Features
- Blue bars signal potential buy trades, pink bars signal potential sell trades.
- Suitable for trending and sideways markets across all timeframes.
- Customizable inputs include CCI period, extreme levels, and bar colors.
- Provides visual guidance for short-term scalping and day trading strategies.
- Signals appear directly on the main price area for easy interpretation.
- Helps traders spot momentum shifts and potential breakout points efficiently.
Indicator Chart
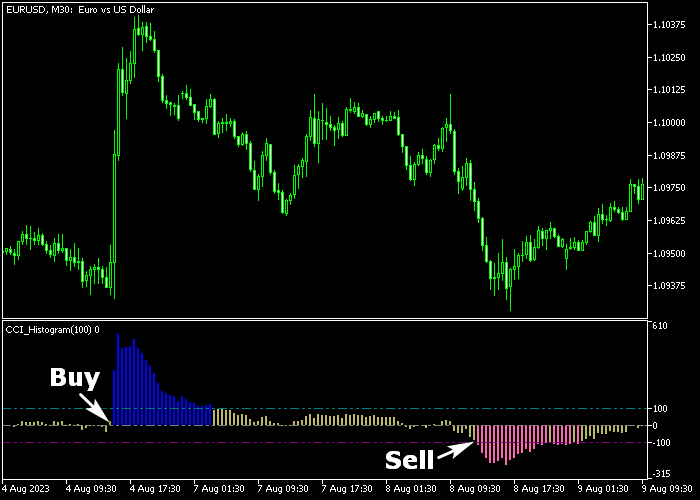
The chart displays the indicator positioned in a separate sub-window below the main price candles.
You can see how the blue bars signify a surge in bullish momentum, while the pink bars indicate a shift toward a bearish trend.
The signals are generated as soon as a bar crosses the median level, providing a specific point for trade execution and trend confirmation.
Guide to Trade with CCI Breakout Histogram Indicator
Buy Rules
- Wait for the histogram to transition from pink or neutral to a solid blue bar.
- Ensure the blue bar has closed above the zero median line to confirm the breakout.
- Open a buy market order at the start of the next candle following the color change.
- Verify that the overall price action is not hitting a major historical resistance zone.
Sell Rules
- Monitor the indicator for a shift from blue or neutral to a solid pink bar.
- Confirm the pink bar has closed below the zero median line for a valid sell signal.
- Execute a sell market order immediately upon the close of the signaling candle.
- Check that a break of recent minor support supports the downward momentum.
Stop Loss
- For buy orders, place the protective stop loss just below the most recent swing low.
- For sell orders, position the stop loss slightly above the most recent swing high.
- Always maintain a logical exit point to protect your capital from sudden market spikes.
Take Profits
- Exit the trade when the histogram changes color back to the opposite signal.
- Alternatively, set a fixed profit target based on a two-to-one reward-to-risk ratio.
- Consider closing a portion of the position at the first major horizontal level.
- Use a trailing stop to lock in gains as the histogram stays strongly colored.
CCI Breakout Donchian Channel Strategy MT5
This day trading strategy combines momentum breakout signals with clear trend structure by using the CCI Breakout Histogram Indicator for MT5 and the Donchian Channels Indicator MT5.
It is designed to capture strong intraday moves when price breaks out in the direction of the trend.
In this strategy, the slope of the Donchian Channel is used as a trend filter.
When the channel slopes upward, it confirms a buy trend. When the channel slopes downward, it confirms a sell trend.
This alignment ensures that trades follow the dominant direction instead of fighting the market.
This approach works best on the M5 to M15 timeframes.
Buy Entry Rules
- Confirm that the Donchian Channel is sloping upward, indicating a bullish trend.
- Wait for the CCI Breakout Histogram Indicator to show a blue bar above the zero level.
- Enter a buy trade immediately after the bullish bar appears.
- Place a stop loss below the recent swing low or near the lower Donchian band.
- Close the trade fully when a pink bar appears or secure profits near the upper channel boundary.
Sell Entry Rules
- Confirm that the Donchian Channel is sloping downward, indicating a bearish trend.
- Wait for the CCI Breakout Histogram Indicator to show a pink bar below the zero level.
- Enter a sell trade immediately after the bearish bar appears.
- Place a stop loss above the recent swing high or near the upper Donchian band.
- Close the trade completely when a blue bar appears or take profit near the lower channel boundary.
Case Study 1: EURGBP Buy Trade
On the M15 timeframe, the Donchian Channel begins to slope upward, indicating a developing bullish trend. Price begins to push toward the upper boundary.
Shortly after, the CCI Breakout Histogram prints a blue bar above zero.
A buy trade is entered immediately as momentum confirms the trend direction.
Price continues rising within the channel, and the trade was closed for 32 pips.
Case Study 2: NZDUSD Sell Trade
On the M5 timeframe, the Donchian Channel slopes downward, confirming bearish conditions. Price stays near the lower portion of the channel.
Shortly after, the CCI Breakout Histogram shows a pink bar below zero. A sell trade is executed right after the signal appears.
Price drops steadily, and the short position was closed for 18 pips.
Download Now
cci-histogram-round.mq5 Indicator (MT5)
FAQ
What is the best time frame for the CCI Breakout Histogram Indicator?
While this tool is versatile enough for any period, it performs with the highest accuracy on the M15 and H1 time frames.
Scalpers may use it on the M5, but should be aware of increased volatility.
Can I change the sensitivity of the histogram signals?
Yes, you can modify the CCI period in the settings menu.
A lower period makes the histogram more sensitive to price changes, which is useful for fast scalping.
A higher period smoothens the histogram, making it better for long-term swing trading and reducing the number of false signals.
Can I use this indicator alongside other technical tools?
This indicator is highly effective when paired with moving averages or support and resistance levels.
Using a long-term moving average helps you filter the histogram signals so that you only take trades in the direction of the primary trend, which increases the overall win rate.
Summary
The CCI Breakout Histogram indicator for MT5 is a robust solution for traders seeking a simplified view of market momentum.
It excels at identifying the exact moment a trend breaks out, providing a significant advantage in both fast-moving and stable markets.
By following the color-coded bars, traders can maintain discipline and avoid the hesitation often caused by complex chart setups.
Testing the indicator on a demo account will help you understand how it reacts to different market conditions before applying it to a live environment.


