The Directional Breakout indicator for Metatrader 5 is a Forex scalping tool that delivers powerful buy and sell signals based on bull/bear trend bias.
It consists of green, yellow, and red colored non-repaint histogram bars and its trade logic goes as follows:
- The green colored histogram bars signal an uptrend.
- The red colored histogram bars signal a downtrend.
- The yellow colored histogram bars are neutral (stand aside).
The following indicator inputs and parameters can be modified: MA period, Ma method, and applied price.
It’s recommended to deploy this FX scalper on the low-spread currency pairs for best trading results (less spread costs).
Make yourself familiar with this technical indicator and test it first on a demo account until you fully understand how it works.
It supports all time frames and Forex pairs (majors, minors, exotic).
Download Indicator 🆓
Directional_Breakout.mq5 Indicator (MT5)
Chart Example
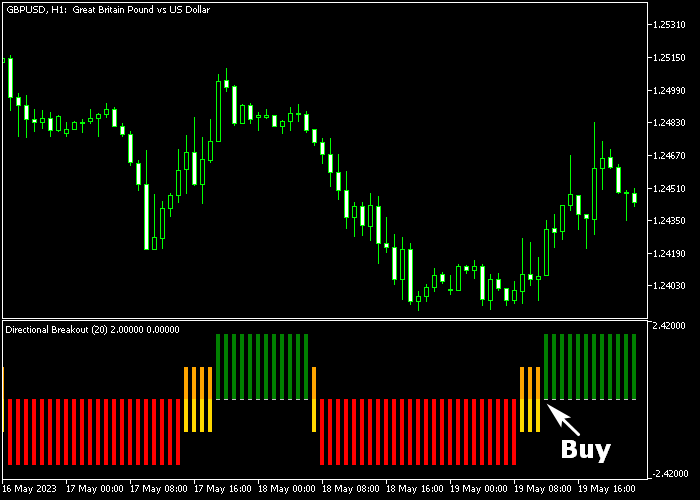
The following chart shows what the Directional Breakout Forex Scalper indicator looks like when applied to the MT5 chart.

How To Buy And Sell Forex Pairs With The Directional Breakout Indicator?
Find a simple trading example below:
Buy Signal
- The first green colored directional breakout bar is a buy signal (see chart above).
- Open a buy trade and place your stop loss slightly below immediate support.
- Exit the buy scalper trade for 6-15 pips profit, or use your own take profit method.
Sell Signal
- The first red colored directional breakout bar is a sell signal.
- Open a sell trade and place your stop loss slightly above immediate resistance.
- Exit the sell scalper trade for 6-15 pips profit, or use your own take profit method.
Download Now 🆓
Directional_Breakout.mq5 Indicator (MT5)
Frequently Asked Questions
How Do I Install This Custom Indicator On Metatrader 5?
- Open the MT5 trading platform
- Click on the File menu button located at the top left part of the platform
- Click on Open Data Folder > MQL5 folder > Indicators
- Copy the Directional_Breakout.mq5 indicator file in the Indicators folder
- Close and restart the trading platform
- You will find the indicator here (Navigator window > Indicators)
- Drag the indicator to the chart to get started with it!
How Do I Edit This Indicator?
- Click in the open chart with your right mouse button
- In the dropdown menu, click on Indicator List
- Select the indicator and click on properties
- Now you can edit the inputs, colors, levels, scale and visualization
- Finally click the OK button to save the new configuration


