About the Gaussian Bands Indicator
The Gaussian Bands indicator for MT5 is designed to help traders identify trend direction and potential pullback opportunities.
It plots two dynamic bands around the price that react to market movement and volatility.
The upper and lower Gaussian bands appear directly around price and act as boundaries within a trend.
When the bands slope upward, the market shows bullish conditions.
When the bands slope downward, the market reflects bearish pressure.
Traders often use this indicator as a buy-on-dips and sell-on-rallies system.
In an uptrend, price frequently retraces toward the lower band before continuing higher.
In a downtrend, rallies toward the upper band can present selling opportunities.
The indicator also offers adjustable settings such as the calculation period, deviation period, and multiplier values.
These parameters allow traders to adapt the sensitivity of the bands to different trading styles and market conditions.
Free Download
Key Features
- Plots upper and lower Gaussian bands around price.
- Helps identify the direction of the current market trend.
- Supports pullback trading within trending conditions.
- Bands expand and contract with price volatility.
- Useful for identifying dip and rally trading opportunities.
- Customizable period and deviation parameters.
- Includes adjustable multiplier values for band calculation.
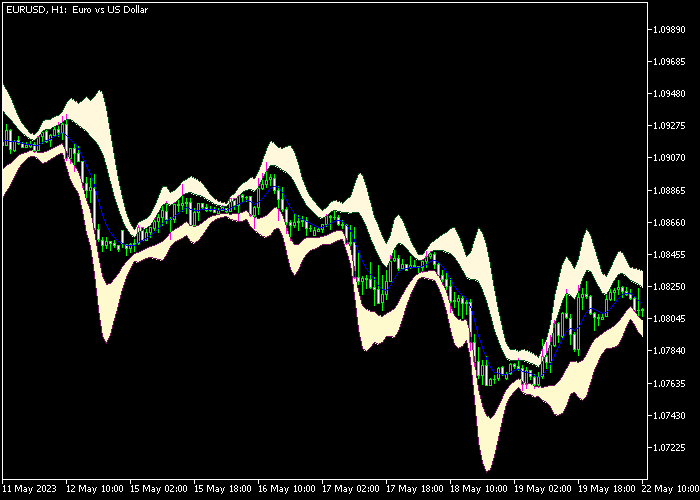
Indicator Chart
The Gaussian Bands Indicator appears directly in the main price area and draws two dynamic bands that surround the current market price.
The bands slope upward during bullish conditions and downward during bearish conditions.
Traders observe how price reacts near these levels to identify potential pullbacks and continuation opportunities.

Guide to Trade with the Gaussian Bands Indicator
Buy Rules
- Confirm that the Gaussian bands are sloping upward.
- Wait for the candle to retrace and touch the lower Gaussian band.
- Enter a buy trade once price reacts from the lower band area.
- This setup targets pullbacks within an active bullish trend.
Sell Rules
- Confirm that the Gaussian bands are sloping downward.
- Wait for the candle to move upward and touch the upper Gaussian band.
- Enter a sell trade once price shows rejection near the upper band.
- This setup focuses on rallies within a bearish trend.
Stop Loss
- Place the stop loss slightly beyond the band used for the entry.
- For buy trades, position the stop a few pips below the lower band.
- For sell trades, position the stop a few pips above the upper band.
Take Profit
- Close the trade when price reaches the opposite Gaussian band.
- Many traders secure partial profits when price approaches the mid range of the move.
Gaussian Bands with Force MACD Signal Forex Strategy for MT5
This strategy combines the Gaussian Bands Indicator with the Force MACD Signal Indicator to build a trend-following system with momentum confirmation.
The Gaussian Bands indicator acts as a dynamic trend filter.
When the bands slope upward, the market is bullish, and when they slope downward, the market is bearish.
This type of indicator behaves similarly to moving averages, helping traders identify trend direction clearly.
The Force MACD Signal indicator provides momentum confirmation using histogram colors.
Green bars indicate bullish momentum, while red bars indicate bearish momentum.
MACD-based histograms are widely used to confirm trend strength and direction.
This combination ensures trades are taken only in the direction of the trend with strong momentum backing the move.
Buy Entry Rules
- Wait for the Gaussian Bands to clearly slope upward, confirming a bullish trend.
- Confirm that the Force MACD Signal shows green histogram bars.
- Enter a buy trade at the open of the next candle after confirmation.
- Place a stop loss below the nearest recent support level or below the lower band.
- Close the trade when the MACD histogram turns red or when the bands start flattening or sloping downward.
Sell Entry Rules
- Wait for the Gaussian Bands to slope downward, confirming a bearish trend.
- Confirm that the Force MACD Signal shows red histogram bars.
- Enter a sell trade at the open of the next candle after confirmation.
- Place the stop loss above the nearest resistance level or above the upper band.
- Close the trade when the MACD histogram turns green or when the bands begin flattening or slope upward.
Case Study 1: Buy Trade
On AUDUSD M15, the Gaussian Bands started sloping upward, showing a developing bullish trend.
Shortly after, the Force MACD Signal printed consecutive green histogram bars.
A buy trade was entered at the next candle open. Price continued trending upward with strong momentum.
The trade was closed when the MACD histogram turned red, signaling weakening bullish momentum.
Case Study 2: Sell Trade
On USDCHF M5, the Gaussian Bands sloped downward, indicating a bearish environment.
At the same time, the Force MACD Signal displayed red histogram bars.
A sell trade was opened at the next candle. Price moved downward steadily.
The trade was closed when the MACD histogram turned green, indicating a potential shift in momentum.
Download Now
FAQ
What does the slope of the Gaussian bands indicate?
The slope shows the direction of the current trend.
Rising bands indicate bullish conditions, while falling bands indicate bearish momentum.
What type of strategy works best with this indicator?
The indicator is commonly used in trend-following strategies where traders enter on pullbacks.
It helps identify areas where price may continue moving in the direction of the trend.
Can the indicator settings be adjusted?
Yes. Traders can modify the period, deviation period, and multiplier values to adjust the responsiveness of the bands to price movement.
Summary
The Gaussian Bands indicator provides traders with a practical way to follow trends and identify pullback opportunities.
The upper and lower bands help highlight areas where price may react during trending conditions.
By combining trend direction with dynamic band levels, traders can evaluate dip buying and rally selling setups more easily.
The adjustable parameters also allow the indicator to be tailored to different trading approaches.
With adjustable parameters and straightforward signals, the indicator offers a practical way to analyze trending conditions and locate pullback zones directly on the trading platform.


