About the Easy Candle Box Breakout Indicator
The Easy Candle Box Breakout indicator for MT5 helps traders identify price breakouts above or below a defined session box.
It is beginner-friendly and allows customization of session start and end times to match your trading schedule.
The indicator displays boxes on the chart with colors representing market bias: green/blue for bullish and red/magenta for bearish.
Traders can use these boxes to anticipate breakout opportunities and align trades with session trends.
Multiple inputs, including session hours, minutes, and shifts, allow precise tailoring to your strategy.
Free Download
shadeny_candle.mq5 Indicator (MT5)
Key Features
- Displays breakout boxes with bullish or bearish color coding.
- Customizable session start and end times for tailored trading periods.
- Adjustable inputs for minutes and shift to match your strategy.
- Beginner-friendly design for easy identification of breakout setups.
- Helps anticipate breakouts before entering trades.
Indicator Chart
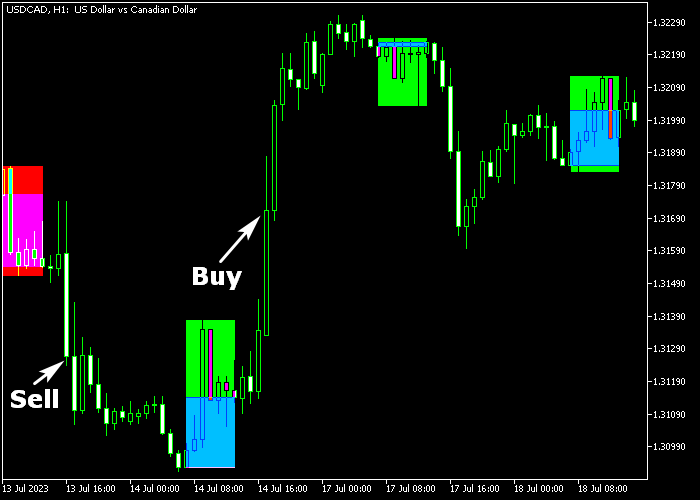
The Easy Candle Box Breakout indicator appears directly on the price area.
Green/blue boxes indicate bullish breakout potential, while red/magenta boxes indicate bearish breakout potential.
Traders can visually track price action relative to the boxes to plan entries and monitor breakout setups effectively.

Guide to Trade with Easy Candle Box Breakout Indicator
Buy Rules
- Look for a green/blue bullish box to appear on the chart.
- Enter a buy trade when a candle closes above the high of the box.
- Use the box’s low as a reference for potential stop placement.
Sell Rules
- Wait for a red/magenta bearish box to appear on the chart.
- Enter a sell trade when a candle closes below the low of the box.
- Use the box’s high as a reference for potential stop placement.
Stop Loss
- For buy trades, place a stop loss slightly below the box low.
- For sell trades, place a stop loss slightly above the box high.
Take Profits
- Set take profit based on your preferred pip target or strategy.
- Optionally exit trades when the opposing box color forms.
- Use nearby support or resistance as alternative exit points.
Easy Candle Box Breakout Indicator Strategy for MT5
This breakout strategy combines the Easy Candle Box Breakout indicator for MT5 with the Parabolic SAR indicator for MT5 to trade high-probability breakouts during the London and New York sessions.
The Easy Candle Box Breakout indicator signals potential breakouts when price closes above the box high for a buy or below the box low for a sell.
The Parabolic SAR adds trend confirmation, with yellow dots below candles indicating a bullish trend and dots above signaling a bearish trend.
This strategy works best on M15 and M30 charts during active market hours when volatility is high, helping traders catch strong breakout moves with trend alignment.
Buy Entry Rules
- Trade during the London or New York session.
- Wait for the candle to close above the candle box high.
- Confirm that the Parabolic SAR shows yellow dots below the candles, indicating an uptrend.
- Enter a buy trade at the opening of the next candle.
- Place the stop loss below the breakout box low.
- Take profit when the Parabolic SAR flips above the candles or when price approaches the next resistance level.
Sell Entry Rules
- Trade during the London or New York session.
- Wait for the candle to close below the candle box low.
- Confirm that the Parabolic SAR shows dots above the candles, indicating a downtrend.
- Enter a sell trade at the opening of the next candle.
- Place the stop loss above the breakout box high.
- Take profit when the Parabolic SAR flips below the candles or when price reaches the next support level.
Case Study 1: Buy Breakout on EUR/USD (London Session)
During the London session on EUR/USD M15, price tested a consolidation box several times before finally closing above the box high.
Yellow Parabolic SAR dots appeared below the candles, confirming an upward trend.
A buy trade was entered at the next candle open. Price accelerated upward with strong momentum, following the trend.
The breakout continued cleanly with minimal retracement.
The trade was closed when the Parabolic SAR flipped above the candles and price approached the next resistance zone.
The position was closed for 39 pips after a sharp intraday breakout move.
Case Study 2: Sell Breakout on GBP/JPY (New York Session)
During the New York session on GBP/JPY M30, price broke below the consolidation box low.
Parabolic SAR dots appeared above the candles, confirming a bearish trend.
A sell trade was entered at the next candle. Price moved downward steadily as selling pressure dominated.
The trend remained intact with clear continuation.
The trade was closed when the Parabolic SAR flipped below the candles and price approached the next support level.
Download Now
shadeny_candle.mq5 Indicator (MT5)
FAQ
Can I change the session times?
Yes, you can customize both session start and end hours, as well as minutes, to match your preferred trading periods.
Which box colors indicate bullish or bearish bias?
Green/blue boxes signal bullish conditions, while red/magenta boxes indicate bearish conditions. These colors guide breakout entries.
Is this indicator suitable for beginners?
Yes, it is beginner-friendly. The visual boxes simplify breakout identification, helping new traders spot potential entries without complex analysis.
Summary
The Easy Candle Box Breakout indicator provides a clear visual system for spotting price breakouts above or below session boxes.
Customizable session hours and inputs allow traders to adapt it to any strategy.
Green/blue and red/magenta boxes signal bullish and bearish potential, helping plan trades effectively.
Testing in a demo account ensures familiarity and helps optimize settings for real market conditions.


