About the EMA Trend Catcher indicator
The EMA Trend Catcher indicator for MT5 identifies trend reversals using two moving averages and generates precise buy or sell signals.
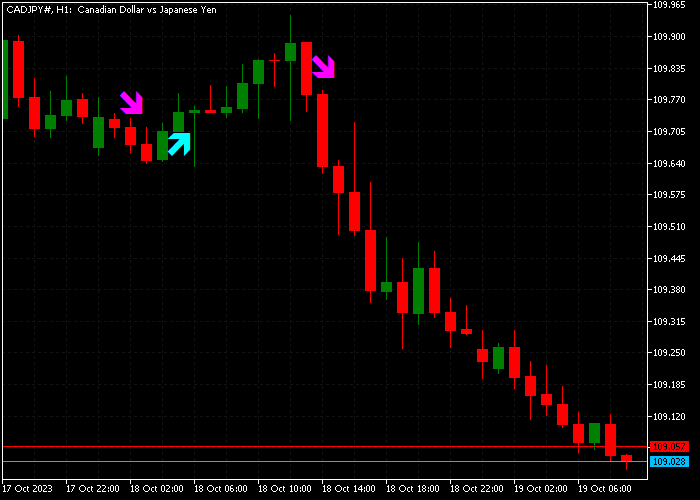
A blue arrow indicates a buying opportunity when the short-term MA crosses above the long-term MA, while a red arrow signals a selling opportunity when the short-term MA crosses below.
This setup helps traders follow market momentum and enter trades in the direction of the trend.
The indicator is displayed directly on the main price area and includes adjustable inputs such as MA periods, alerts, and mobile notifications.
It works across all timeframes and can be applied to various trading instruments, making it suitable for both intraday and swing trading strategies.
Free Download
Ganesha Trend Viewer MT5.mq5 Indicator (MT5)
Key Features
- Signals trend reversals with blue (buy) and red (sell) arrows.
- Uses short-term and long-term moving averages for trend detection.
- Configurable MA periods, alerts, and mobile notifications.
- Provides actionable trade cues without overcrowding the chart.
- Supports both intraday and swing trading strategies.
Indicator Chart
The EMA Trend Catcher indicator appears on the main price area as blue and red arrows.
Blue arrows indicate potential buy signals, and red arrows indicate potential sell signals.
The chart displays trend reversals clearly, helping traders identify optimal entry and exit points based on MA crossovers.
Guide to Trade with EMA Trend Catcher
Buy Rules
- Open a buy trade when a blue EMA Trend Catcher arrow appears.
- Ensure that price action aligns with upward momentum before entering.
Sell Rules
- Open a sell trade when a red EMA Trend Catcher arrow appears.
- Ensure that price action aligns with downward momentum before entering.
Stop Loss
- For buy trades, place the stop loss 3 pips below the most recent swing low.
- For sell trades, place the stop loss 3 pips above the most recent swing high.
- Consider using a trailing stop to protect profits during strong trends.
Take Profit
- Close buy trades at your preferred fixed take profit level or when a red arrow appears.
- Close sell trades at your preferred fixed take profit level or when a blue arrow appears.
- Partial exits can secure profits while letting the remainder follow the trend.
Download Now
Ganesha Trend Viewer MT5.mq5 Indicator (MT5)
FAQ
How does EMA Trend Catcher detect trend reversals?
The indicator monitors short-term and long-term MA crossovers.
A blue arrow appears when the short MA crosses above, and a red arrow appears when it crosses below, signaling trend changes.
Can I customize alerts and notifications?
Yes, you can enable visual alerts, sound notifications, and mobile push notifications for each signal to stay updated without watching the chart constantly.
Is EMA Trend Catcher suitable for all instruments?
Yes, it works effectively on forex pairs, indices, commodities, and other instruments that display clear price trends.
Summary
The EMA Trend Catcher indicator simplifies trend trading by highlighting potential reversals with blue and red arrows.
Adjustable MA periods and alert options make it flexible across instruments and timeframes.
Its signals help traders identify high-probability entry and exit points while keeping the chart clean.
Overall, it is a practical tool for traders who want clear trend cues and efficient trade execution without overcomplicating analysis.


