
The Fast Scalper Forex Forecast indicator for Metatrader 5 helps scalpers identify multiple small profit trades daily.
Typically, we are looking for 3-10 pips profit per transaction.
It’s recommended to deploy this tool on the lower spread currency pairs only for the best success rate.
How to trade with this scalper indicator?
- Both signal lines above the zero level generates a buy scalper signal.
- Both signal lines below the zero level generates a sell scalper signal.
The following indicator inputs and parameters can be modified: period, applied price, and signal period.
The more volatile London and American trading sessions would fit this indicator the most.
Please make yourself familiar with this technical indicator and test it first on a demo account for an extended period.
It supports all time frames and Forex pairs.
Download Indicator 🆓
Chart Example
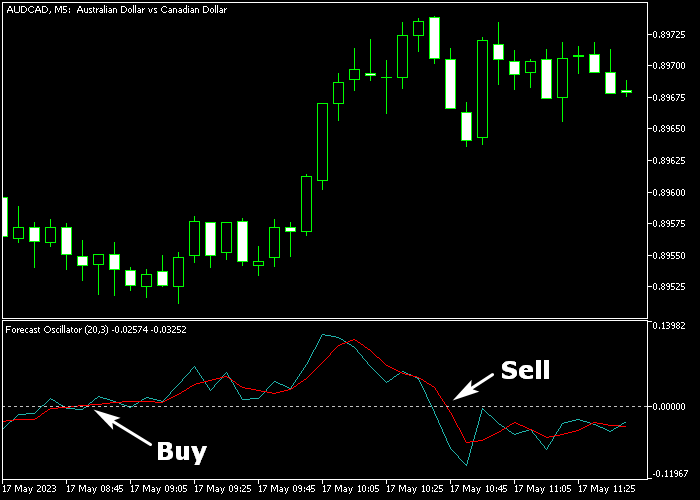
The following chart shows what the Fast Scalper Forecast indicator looks like when applied to the MT5 chart.
How To Buy And Sell Currency Pairs With The Fast Scalper Forex Forecast Indicator?
Find a simple trading example below:
Buy Signal
- A buy signal is given when both signal lines turn back above the zero level.
- Execute a buy order and set a protective stop loss order below immediate support.
- Exit the buy trade for 3- 10 pips profit.
Sell Signal
- A sell signal is given when both signal lines turn back below the zero level.
- Execute a sell order and set a protective stop loss order above immediate resistance.
- Exit the sell trade for 3- 10 pips profit.
Download Now 🆓
Frequently Asked Questions
How Do I Install This Custom Indicator On Metatrader 5?
- Open the MT5 trading platform
- Click on the File menu button located at the top left part of the platform
- Click on Open Data Folder > MQL5 folder > Indicators
- Copy the Forecast.mq5 indicator file in the Indicators folder
- Close and restart the trading platform
- You will find the indicator here (Navigator window > Indicators)
- Drag the indicator to the chart to get started with it!
How Do I Edit This Indicator?
- Click in the open chart with your right mouse button
- In the dropdown menu, click on Indicator List
- Select the indicator and click on properties
- Now you can edit the inputs, colors, levels, scale and visualization
- Finally click the OK button to save the new configuration


