
About the Deviation Oscillator
The Deviation Oscillator is a momentum based technical indicator for MT5 that helps traders identify potential buy and sell opportunities using a moving average calculation.
It measures how far price deviates from its average value and presents this information as a single oscillating line.
The indicator appears beneath the main price area as a gold line that moves above and below the zero level.
When the oscillator remains above zero, it suggests bullish market momentum. When the line moves below zero, it indicates bearish pressure.
Traders often monitor zero level crossovers because they can signal a shift in market direction.
A move from below zero to above zero may indicate the start of bullish momentum, while a move from above zero to below zero may suggest a developing downtrend.
The indicator includes customizable settings such as moving average period, minimum and maximum period, calculation method, and applied price.
Free Download
Deviation_Oscillator.mq5 Indicator (MT5)
Key Features
- Momentum oscillator based on moving average deviation.
- Gold line oscillates above and below the zero level.
- Zero line crossovers provide potential trade signals.
- Helps identify bullish and bearish market conditions.
- Adjustable moving average period and calculation method.
- Configurable minimum and maximum period parameters.
- Compatible with other technical analysis tools.
Indicator Chart
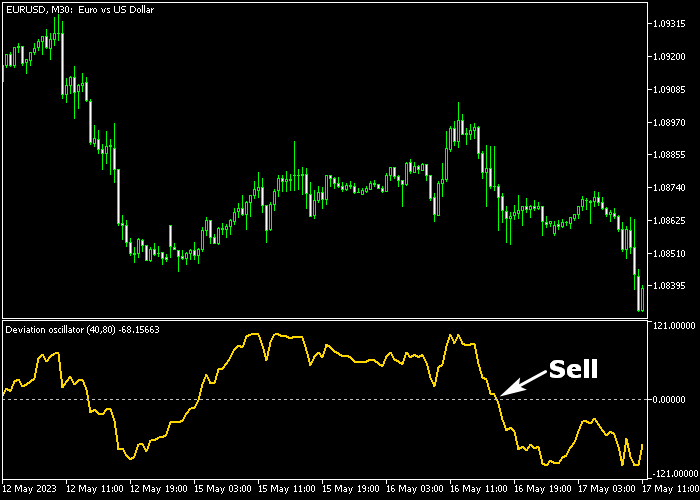
The Deviation Oscillator appears beneath the main price area as a gold line that fluctuates around the zero level.
When the line rises above zero, it reflects bullish momentum. When it moves below zero, it indicates bearish conditions and potential sell opportunities.
Guide to Trade with Deviation Oscillator
Buy Rules
- Wait for the gold oscillator line to cross the zero level from below.
- Confirm that the line continues moving above the zero level.
- Open a buy position once bullish momentum develops.
- Hold the trade while the oscillator remains above zero.
Sell Rules
- Wait for the gold oscillator line to cross the zero level from above.
- Confirm that the line moves downward below the zero level.
- Open a sell position once bearish momentum appears.
- Stay in the trade while the oscillator remains below zero.
Stop Loss
- Place the stop loss a few pips below the recent market low after opening a buy trade.
- Place the stop loss a few pips above the recent market high after opening a sell trade.
- Reduce position size if a wider stop loss is required.
Take Profit
- Close all buy trades when the oscillator crosses the zero level downward.
- Close all sell trades when the oscillator crosses the zero level upward.
- Alternatively, exit the trade at a fixed risk to reward ratio.
Deviation Oscillator Indicator MT5 Scalping Strategy
This scalping strategy combines the Deviation Oscillator with the VIDYA Indicator to create a responsive system that captures short-term momentum within a defined trend.
The Deviation Oscillator measures price deviation from its average and highlights momentum shifts.
When the gold oscillator line moves above the zero level, it signals bullish momentum. When it drops below zero, it signals bearish momentum.
This makes it useful for spotting quick intraday reversals and continuation moves.
The VIDYA Indicator acts as a dynamic trend filter that adapts to market volatility.
A lime green line indicates a bullish trend, while a deep pink line indicates a bearish trend.
This helps traders stay aligned with the current direction and avoid entering trades against the trend.
This strategy works best on M1 and M5 charts and is suitable for fast-paced scalping during active sessions.
Buy Entry Rules
- Wait for the VIDYA line to turn lime green, confirming a bullish trend.
- Wait for the Deviation Oscillator gold line to cross above the zero level.
- Enter a buy trade at the close of the confirmation candle.
- Place stop loss below the most recent swing low or slightly below the VIDYA line.
- Close the trade when the oscillator drops back below zero or when the VIDYA line turns deep pink.
Sell Entry Rules
- Wait for the VIDYA line to turn deep pink, confirming a bearish trend.
- Wait for the Deviation Oscillator gold line to cross below the zero level.
- Enter a sell trade at the close of the confirmation candle.
- Place stop loss above the most recent swing high or slightly above the VIDYA line.
- Close the trade when the oscillator moves back above zero or when the VIDYA line turns lime green.
Case Study 1: Oscillator Momentum Buy Setup
On EURJPY M1, the VIDYA line turned lime green as price began forming higher lows, indicating a shift into bullish conditions.
The market showed short bursts of upward movement with small pullbacks.
Shortly after, the Deviation Oscillator gold line crossed above the zero level, confirming bullish momentum.
A buy trade was entered at the close of the confirmation candle.
The stop loss was placed just below the recent swing low and slightly under the VIDYA line to protect against minor retracements.
Price continued moving upward in small waves.
The trade was closed when the oscillator dropped back below zero, signaling weakening momentum.
Case Study 2: Trend Filter Sell Setup
On GBPUSD M5, the VIDYA line turned deep pink as price started forming lower highs and remained below the indicator, confirming bearish conditions.
During a brief pullback, the Deviation Oscillator moved above zero but quickly reversed and crossed back below, signaling renewed selling pressure.
A sell trade was entered at the close of that candle.
The stop loss was placed above the recent swing high and slightly above the VIDYA line to allow normal volatility.
Price moved downward in a controlled manner with small retracements.
The trade was closed when the oscillator crossed back above zero, indicating a possible slowdown in the bearish move.
Download Now
Deviation_Oscillator.mq5 Indicator (MT5)
FAQ
Which parameters can be adjusted in the indicator?
The indicator allows traders to modify the moving average period, minimum and maximum period, calculation method, and applied price.
These settings control how quickly the oscillator reacts to price movement.
What type of trading strategies work with this oscillator?
The Deviation Oscillator works well with momentum and trend following strategies.
Traders often combine it with support and resistance levels or moving averages to confirm trade entries.
Can the indicator be used on different timeframes?
Yes. The oscillator works on both lower and higher timeframes.
Shorter timeframes may provide faster signals while higher timeframes help identify broader momentum shifts.
Summary
The Deviation Oscillator provides a straightforward way to monitor market momentum using a moving average based calculation method.
The gold line moving above and below the zero level helps traders quickly recognize bullish and bearish market conditions.
Zero level crossovers can highlight potential entry opportunities when momentum shifts from buyers to sellers or vice versa.
This makes the indicator useful for traders who rely on momentum confirmation before entering a trade.
With flexible settings and simple interpretation, the Deviation Oscillator can be applied to different currency pairs and trading styles.
It offers a practical method for tracking momentum and identifying possible trend changes in the market.





